NanoWorld CEO Manfred Detterbeck is in Boston for the MRS Fall 2024 Meeting & Exhibit this week.
You’ll meet him at some of the sessions or at NanoAndMore USA booth no. 402.
If you’re there too feel free to say hi and have a chat about #AFMprobes with him.
Happy to be at MRS Fall 2024. Hope to see many of you here.
The viscoelastic behavior of soft materials, especially cells and tissues, has been extensively investigated due to its importance in many biological and physiological processes that take place during development and even disease.*
Many techniques are used to quantify the mechanical properties of cells, among them micropipette aspiration, optical stretching, deformability cytometry and atomic force microscopy (AFM).*
The AFM, in particular, is still nowadays one of the most popular methods due to its conformity with various material types and geometries and the rather simple analysis process of the material properties.*
For a typical AFM indentation measurement, an AFM cantilever, with a distinct AFM tip shape, moves toward the sample with a predefined velocity and indents it until a prescribed force is reached. The AFM cantilever then moves upwards while detaching from the sample. The deflection and displacement signals of the AFM cantilever are processed further to extract the mechanical properties of the sample. Generally, a Hertzian model is fitted to the approach part of the force-indentation curves to quantify the apparent Young’s modulus.*
When applying the Hertzian model, few assumptions need to be considered, such as the material being homogeneous, isotropic, and linearly elastic. *
Cells and tissues, however, show not only elastic but also viscous behavior that is evident from the hysteresis between the approach and retraction segments of the force-indentation curve. Consequently, assessing this viscoelastic behavior is imperative for understanding the complex nature of biological matter.*
A number of studies utilized AFM to measure the viscoelastic properties of cells in both time and frequency domains.*
Ideally, to investigate the whole range of the viscoelastic behavior one needs to probe the material for a long time and observe its response or apply oscillatory signals and evaluate its phase lag. These approaches require the user to alter the probing method and add several steps to account for the time-dependent drift or the effect of the hydrodynamic drag of the surrounding medium. On top of that, in many of studies, the biological materials were probed with a linear approach followed by immediate retraction. The force-indentation curves from these studies were used to evaluate the apparent elastic modulus of the probed material using the standard Hertzian model. However, additional information concerning energy dissipation can still be extracted from the same curves to evaluate the viscoelasticity of the material.*
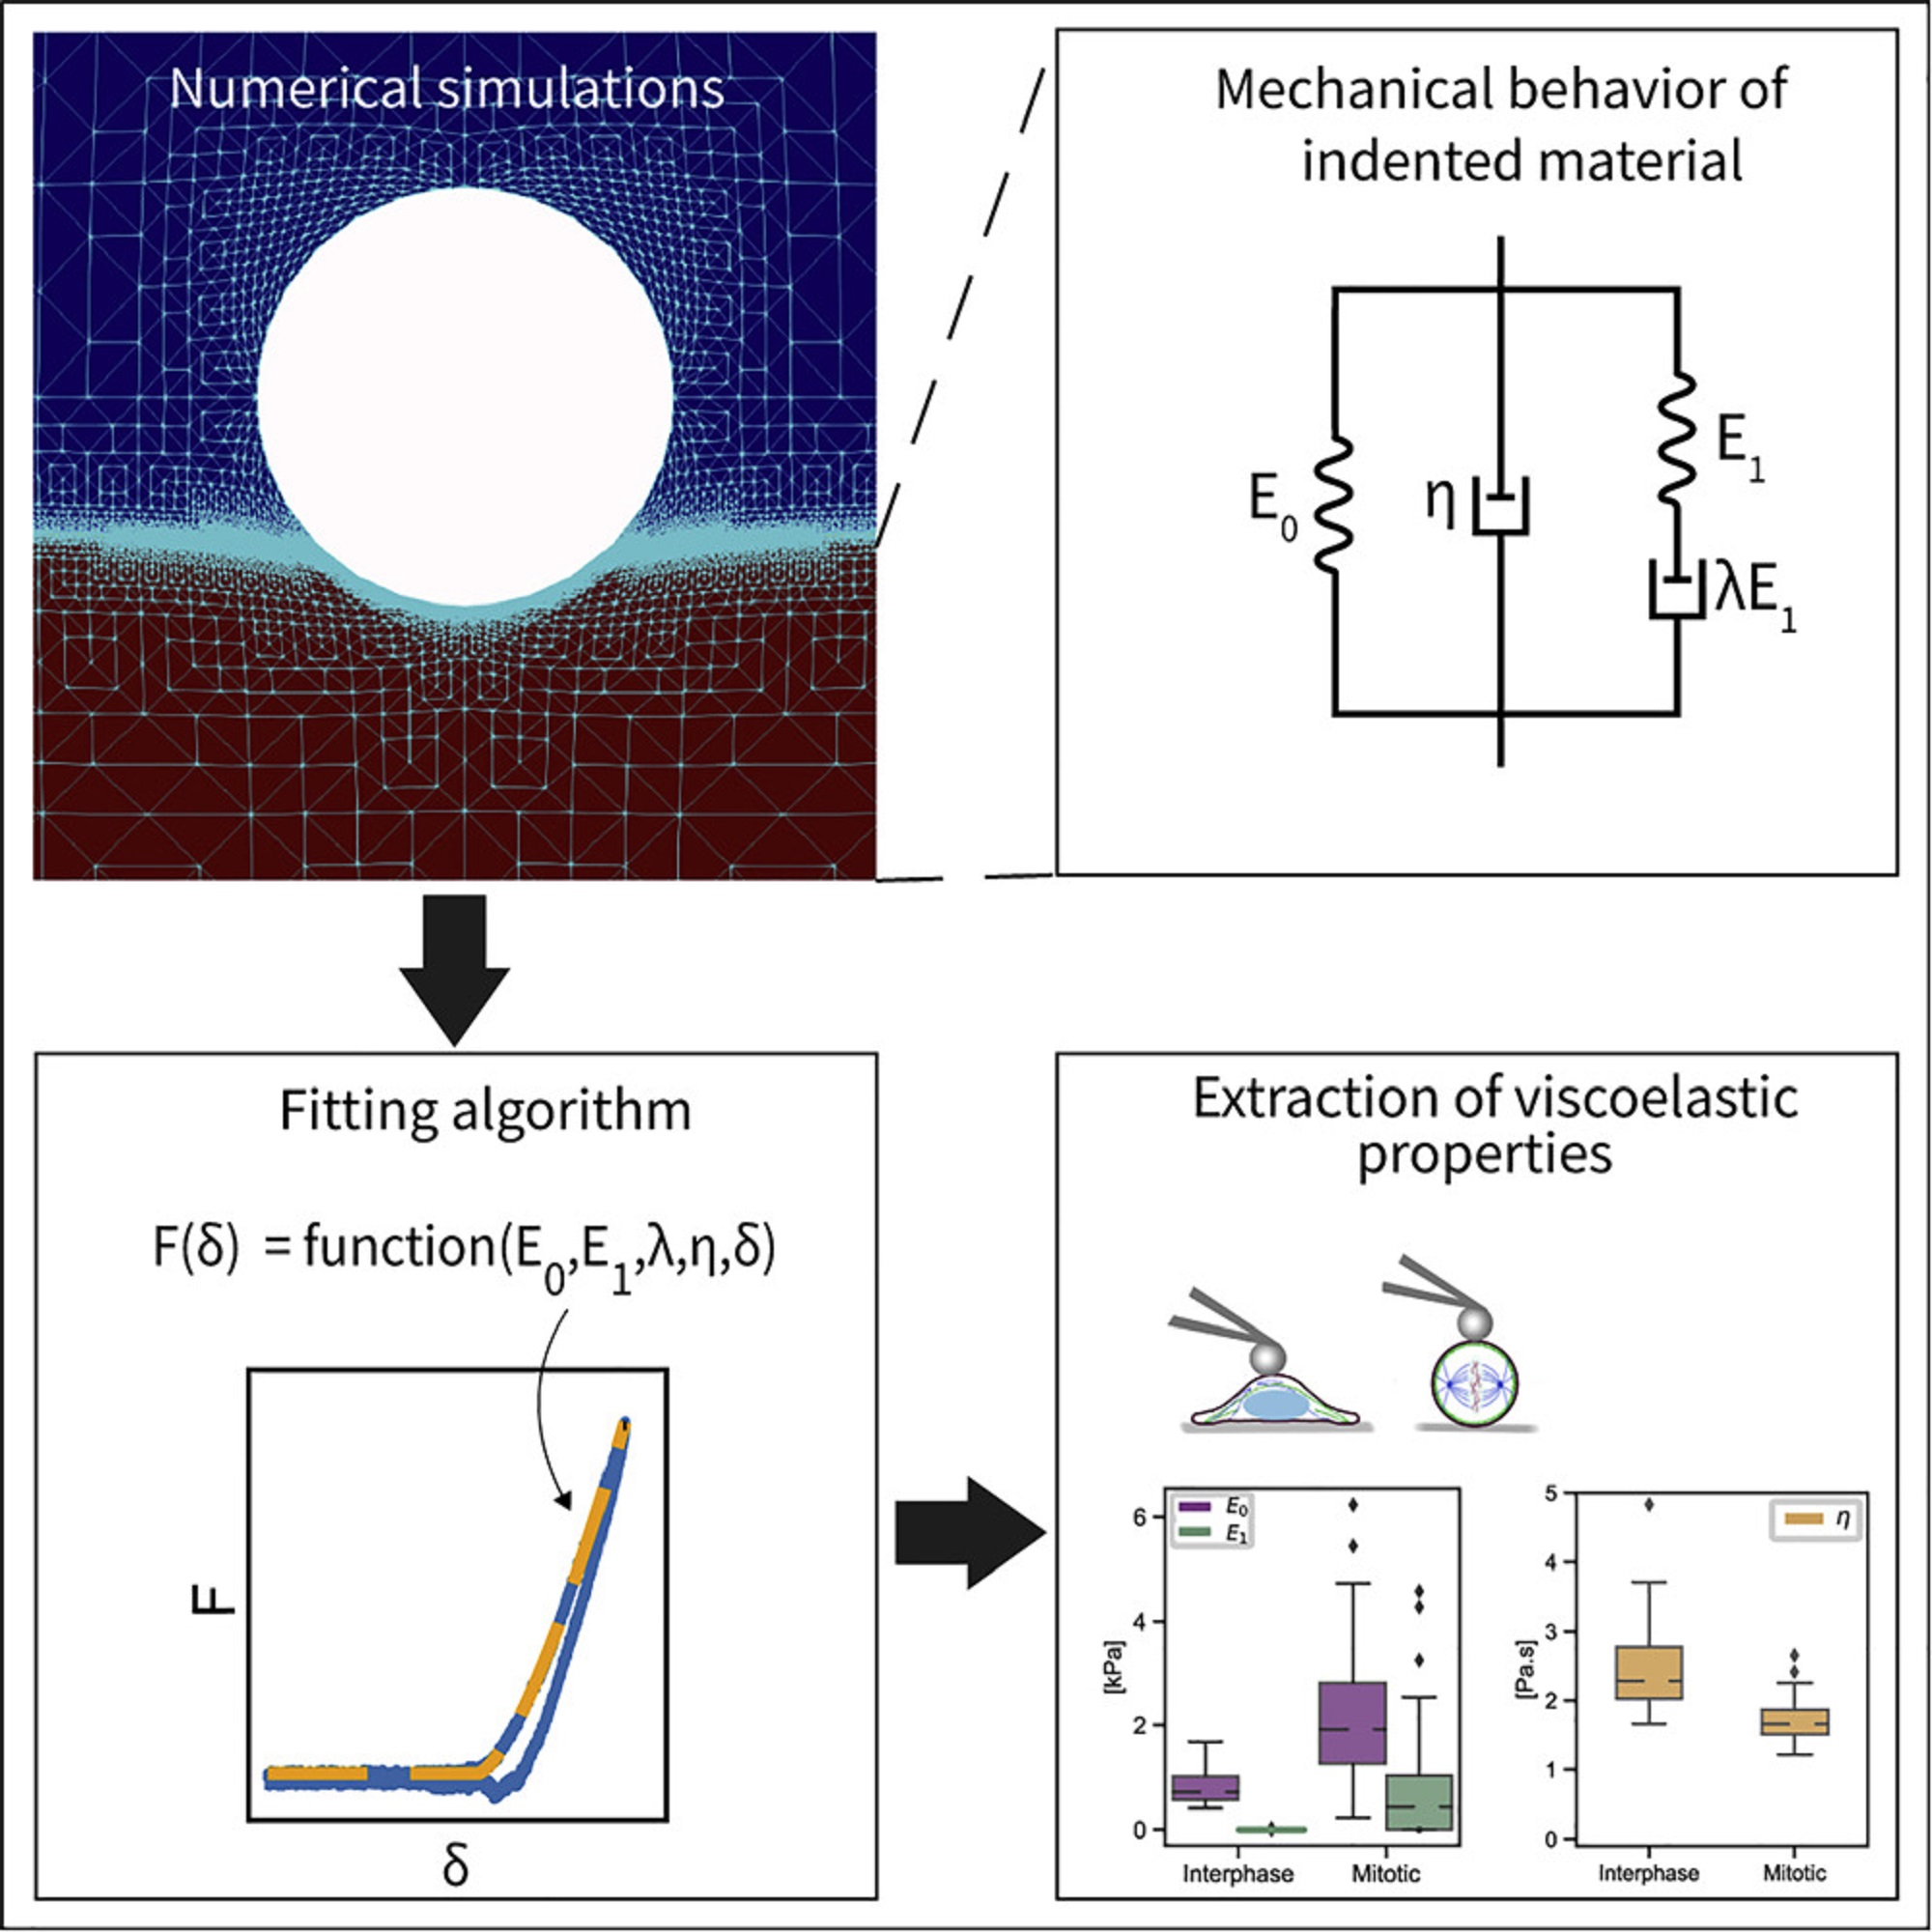
In the article “An explicit model to extract viscoelastic properties of cells from AFM force-indentation curves”, Shada Abuhattum, Dominic Mokbel, Paul Müller, Despina Soteriou, Jochen Guck and Sebastian Aland propose a new fitting model to extract the viscoelastic properties of soft materials from AFM force-indentation curves. *
To construct the explicit relation of force and indentation, the authors first use a generalization of Maxwell and Kelvin-Voigt models to describe soft materials, and numerically simulate the indentation of such material with a spherical indenter. *
Shada Abuhattum et al. show that the proposed Kelvin-Voigt-Maxwell (KVM) model adequately captures the force-indentation curves of materials having different mechanical characteristics. *
Based on the simulation results, Shada Abuhattum et al. further propose an explicit force-indentation relation to be fitted to the force-indentation curves. This explicit relation simplifies the association of the mechanical properties with physically meaningful components and processes.
Finally, the authors apply the fitting model to a number of samples, including poroelastic and viscoelastic hydrogels as well as HeLa cells in two different cell cycle phases, interphase and mitotic. *
Shada Abuhattum et al. demonstrate that the distinct nature of the hydrogels, arising from the different crosslinking mechanisms, can be described with the fitting model. For the HeLa cells, the mitotic cells had a higher apparent elasticity and a lower apparent viscosity, implying a stiffer actin cortex and a diluted cytoplasm protein concentration, when compared with interphase cells.*
Their findings demonstrate that the proposed model can reliably extract viscoelastic properties from conventional force-indentation curves. Moreover, the model is able to assess the contribution of the different elastic and viscous elements, and thus allows a direct comparison between the viscoelastic nature of different materials.*
AFM measurements were preformed using a commercially available Atomic Force Microscope. To indent the samples, NanoWorld Pyrex-Nitride tipless AFM cantilevers PNP-TR-TL with a nominal spring constant of 0.08 mN/m were modified by gluing 5 μm diameter polystyrene beads to the underside of the AFM cantilevers using two component glue.*
The AFM cantilevers were calibrated prior to each experiment using the thermal noise method and their accurate spring constant ranged between 0.047-0.059 mN/m. For PAAm and agarose hydrogels, the AFM cantilever was lowered with a constant velocity (5, 10, or 15 μm/s) toward the surface of the sample until a force of 2 nN for agarose and 4 nN for PAAm was reached. These force set points accounted for an indentation in the range of 0.5–1 μm. For HeLa cells, the AFM cantilever was lowered with a constant velocity of 2 μm/s and the cells were indented until a force of 2 nN was reached, which accounted for an indentation depth in the range of 0.5–1.5 μm.*
Graphical abstract for the article “An explicit model to extract viscoelastic properties of cells from AFM force-indentation curves” by Shada Abuhattum at al. 2022. NanoWorld Pyrex-Nitride tipless AFM cantilevers PNP-TR-TL with a nominal spring constant of 0.08 mN/m were modified by gluing 5 μm diameter polystyrene beads to the underside of the AFM cantilevers using two component glue were used for the atomic force microscopy indentation measurements described in the cited article.
*Shada Abuhattum, Dominic Mokbel, Paul Müller, Despina Soteriou, Jochen Guck and Sebastian Aland An explicit model to extract viscoelastic properties of cells from AFM force-indentation curves
iScience, Volume 25, ISSUE 4, 104016, April 15, 2022
DOI: https://doi.org/10.1016/j.isci.2022.104016
The article “An explicit model to extract viscoelastic properties of cells from AFM force-indentation curves” by Shada Abuhattum, Dominic Mokbel, Paul Müller, Despina Soteriou, Jochen Guck and Sebastian Aland is licensed under a Creative Commons Attribution 4.0 International License, which permits use, sharing, adaptation, distribution and reproduction in any medium or format, as long as you give appropriate credit to the original author(s) and the source, provide a link to the Creative Commons license, and indicate if changes were made. The images or other third-party material in this article are included in the article’s Creative Commons license, unless indicated otherwise in a credit line to the material. If material is not included in the article’s Creative Commons license and your intended use is not permitted by statutory regulation or exceeds the permitted use, you will need to obtain permission directly from the copyright holder. To view a copy of this license, visit https://creativecommons.org/licenses/by/4.0/.
Collagen is the most abundant structural protein in mammals. *
Type I collagen in its fibril form has a characteristic pattern structure that alternates two regions called gap and overlap. The structure and properties of collagens are highly dependent on the water and mineral content of the environment. *
In the article “Interfacial water on collagen nanoribbons by 3D AFM” Diana M. Arvelo, Clara Garcia-Sacristan, Enrique Chacón, Pedro Tarazona and Ricardo Garcia describe how they apply three dimensional atomic force microscopy (3D AFM) to characterize at angstrom-scale resolution the interfacial water structure of collagen nanoribbons.*
Three-dimensional AFM (3D AFM) is an AFM method developed for imaging at high-spatial resolution solid–liquid interfaces in the three spatial coordinates.*
This method has provided atomic-scale images of hydration and solvation layers on a variety of rigid and atomically flat surfaces, such as mica, gibbsite, boehmite, graphite, or 2D materials.*
However, imaging hydration layers on soft materials such as collagen is more challenging than on atomically flat crystalline surfaces.*
On the one hand, the force applied by the AFM tip might deform the protein. On the other hand, the height variations across gap and overlap regions might complicate the imaging of interfacial water.*
In recent years, 3D AFM has expanded its capabilities to image interfacial water on soft materials such as proteins, biopolymers, DNA, lipids, membrane proteins, and cells.*
Those experiments were performed with hydrophilic SiOx AFM tips which are negatively charged under neutral pH conditions.*
The imaging contrast mechanisms and the role of the AFM tip’s composition on the observed solvation structure are under discussion.*
More generally, both theory and experiments performed with very high salt concentrations indicated that the contrast observed in 3D AFM reflects an interplay between water particle and surface charge density distributions.*
For their article the authors apply 3D AFM to study at molecular-scale spatial resolution the structure of interfacial water on collagen nanoribbons.*
Diana M. Arvelo et al. study the influence of the AFM tip’s charge and the salt concentration on the interfacial solvent structure. They report that the interfacial structure depends on the water particle and ion charge density distributions. A non-charged AFM tip reveals the formation of hydration layers on both gap and overlap regions. A negatively charged AFM tip shows that on a gap region, the solvation structure might depart from that of the hydration layers. This effect is attributed to the adsorption of ions from the solution. Those ions occupy the voids existing between collagen molecules in the gap region. *
A home-made three-dimensional AFM was implemented on a commercially available AFM. 3D AFM was performed in the amplitude modulation mode by exciting the AFM cantilever at its first eigenmode.
At the same time when the AFM cantilever oscillates with respect to its equilibrium position, a sinusoidal signal is applied to the z-piezo to modify the relative z-distance between the sample and the AFM tip. *
Diana M. Arvelo et al. have used z-piezo displacements with amplitudes of 2.0 nm and a period (frequency) of 10 ms (100 Hz). The z-piezo signal is synchronized with the xy-displacements in such a way that for each xy-position on the surface of the material, the AFM tip performs a single and complete z-cycle. The z-data are read out every 10.24 µs and stored in 512 pixels (256 pixels per half cycle). Each xy-plane of the 3D map contains 80 × 64 pixels. Hence, the total time to acquire such a 3D-AFM image is 52 s.*
The 3D AFM experiments were performed with two types of AFM probes with different surface chemistries which have different chemical properties in aqueous solutions.*
The high-density carbon/diamond-like AFM tips grown on quartz-like AFM cantilevers that Diana M. Arvelo et al. et al used ( NanoWorld Ultra-Short CantileversUSC-F1.2-k7.3 for high-speed AFM) remain uncharged at pH 7.4 and are called “neutral” AFM tips in the article.
The silicon AFM cantilevers with silicon AFM tips (NanoWorld Arrow-UHFAuD ultra-high frequency AFM probes) are negatively charged at neutral pH (silicon tips for short in the text) and were used to observe the formation of collagen nanoribbons.
All silicon AFM tips are readily oxidized and are usually covered by a thin native oxide layer which is hydrophilic.
The hydroxyl groups on the surface of the silicon AFM tip become negatively charged while the carbon AFM tips remain neutral (unchanged).
To image at angstrom-scale resolution, the interfacial water structure on the collagen requires reducing the lateral and vertical imaging sizes, respectively, to 5 and 1.5 nm.*
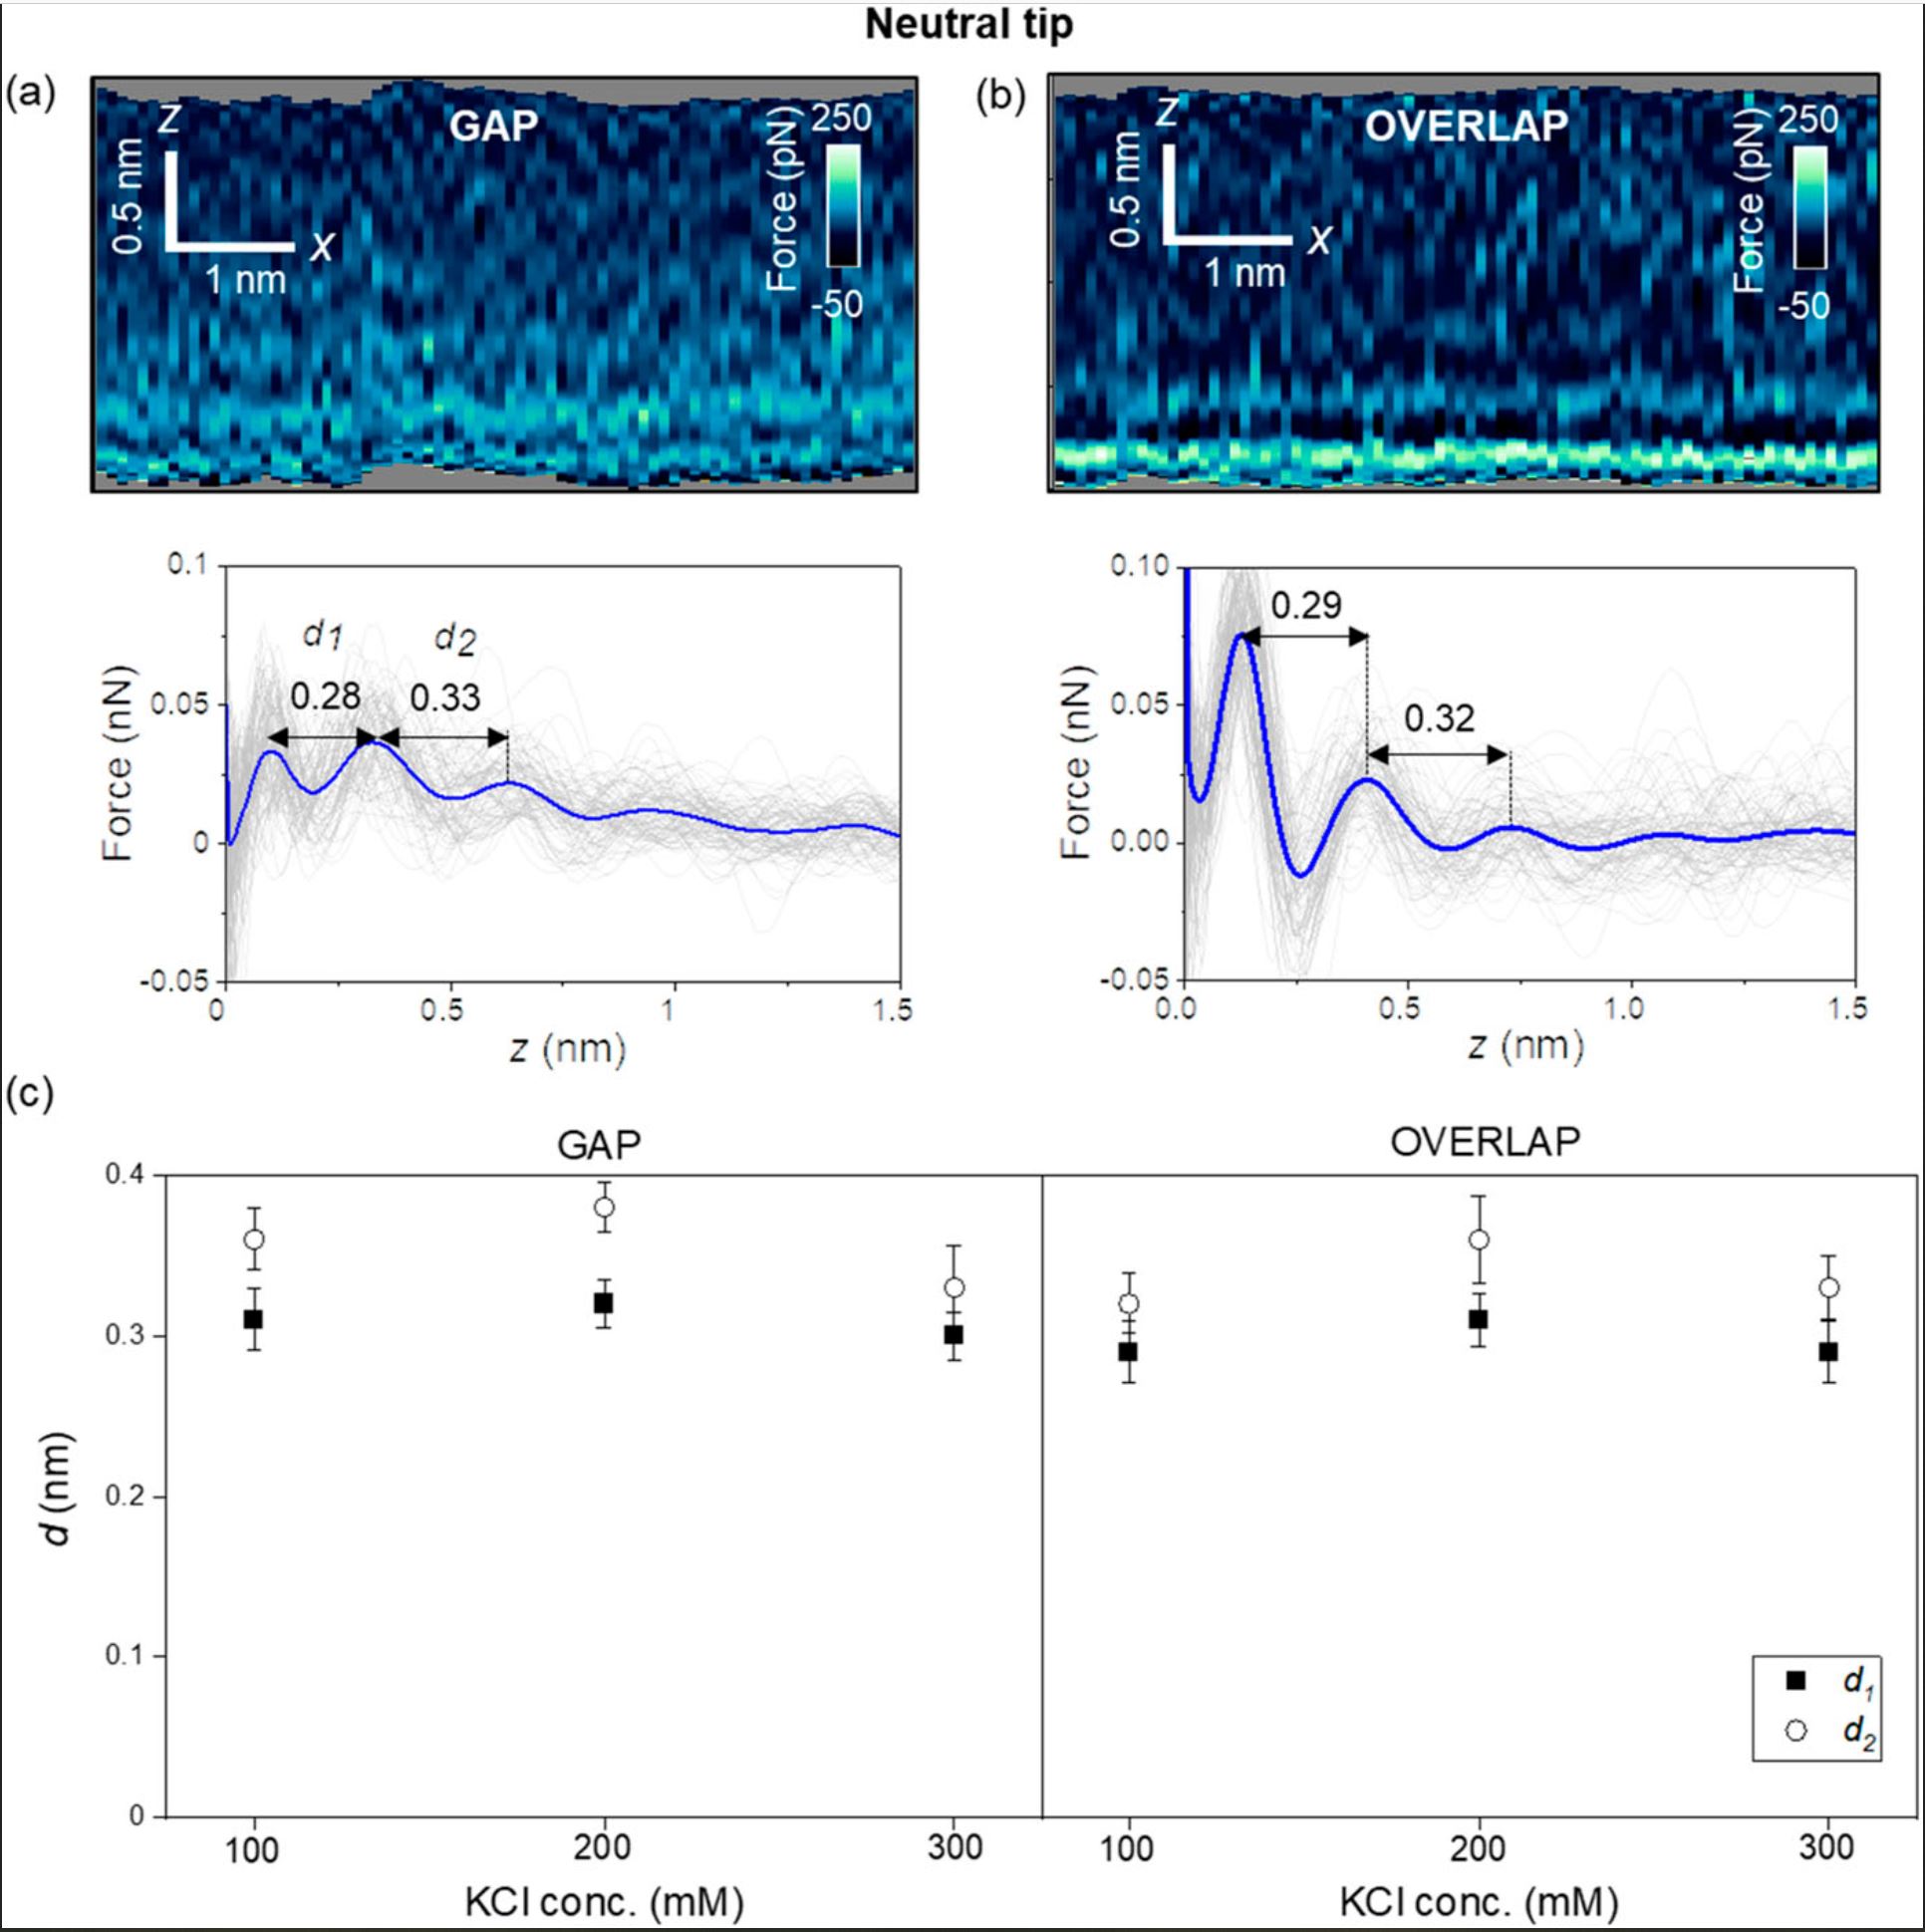
First, the authors introduce the results obtained with carbon-based tips (uncharged, NanoWorld Ultra-Short CantileversUSC-F1.2-k7.3 for high-speed AFM). Figure 2 (of the cited article) shows some representative 2D force xz panels obtained on gap and overlap regions of a collagen nanoribbon in a concentration of 300 mM KCl. The panels are extracted from a 3D AFM image. The interlayer distances in a gap region are d1 = 0.28 nm and d2 = 0.33 nm (average values) [Fig. 2(a)], while those in an overlap region are d1 = 0.29 and d2 = 0.32 nm (average values) [Fig. 2(b)]. Those values coincide within the experimental error with the values expected for hydration layers on hydrophilic surfaces.
Next, the authors repeated the experiment using other salt concentrations. Figure 2(c) shows that the interlayers distances (within the experimental error) do not depend on the salt concentration or the collagen region. Diana M. Arvelo et al. remark that entropic effects make the second layer more disordered than the first; therefore, d2 ≥ d1.
The structure and properties of collagens are highly dependent on the water and mineral content of the environment.
For a neutral AFM tip (USC-F1.2-k7.3), the interfacial water structure is characterized by the oscillation of the water particle density distribution with a value of 0.3 nm (hydration layers). The interfacial structure does not depend on the collagen region.
Hydration layers are observed in overlap regions, while in gap regions, the interfacial solvent structure is dominated by electrostatic interactions. These interactions generate interlayer distances of 0.2 nm.
The achieved results still need to be explained by the theory of 3D AFM. More detailed theoretical simulations, which are beyond the scope of the cited study, will be required to quantitatively explain the interlayer distances observed over gap regions.
However, the results presented by the authors highlight the potential of 3D AFM to identify the solvent structures on proteins and the complexity of those interfaces.*
Figure 2 from Diana M. Arvelo et al. 2024 “Interfacial water on collagen nanoribbons by 3D AFM” Interfacial liquid water structure on collagen provided by an uncharged tip. (a) 2D force maps (x, y) of the interfacial water structure in the gap region. The map is obtained in a 300 mM KCl solution. The force–distance curves in the bottom of the image are obtained from the top panel. (b) 2D force maps (x, y) of the interfacial water structure in the overlap region. The force–distance curves in the bottom of the image are obtained from the top panel. (c) Statistics of d1 and d2 distances measured from several collagen–water interfaces. The individual force–distance curves from the bottom panels of (a) and (b) are plotted in gray. The average force–distance curve is highlighted by a thick continuous line. The experiments are performed with USC-F1.2-k7.3 cantilevers. Experimental parameters: f = 745 kHz; k = 6.7 N m−1; Q = 8.3; A0 = 150 pm; Asp = 100 pm.
Figure 3 from Diana M. Arvelo et al. 2024 “Interfacial water on collagen nanoribbons by 3D AFM” Interfacial liquid water structure on collagen provided by a negatively charged tip. (a) 2D force maps (x, y) of the interfacial water structure in the gap region. The map is obtained in a 300 mM KCl solution. The force–distance curves in the bottom of the image are obtained from the top panel. (b) 2D force maps (x, y) of the interfacial water structure in the overlap region. The force–distance curves in the bottom of the image are obtained from the top panel. (c) Statistics of d1 and d2 distances measured from several collagen–water interfaces. In the bottom panels of (a) and (b), the individual force–distance curves from the bottom panels of (a) and (b) are plotted in gray. The average force–distance curve is highlighted by a thick continuous line. The images were captured using ArrowUHF AuD cantilevers. Experimental parameters: f = 745 kHz; k = 8.3 N m−1; Q = 4.5; A0 = 170 pm; Asp = 100 pm.
*Diana M. Arvelo, Clara Garcia-Sacristan, Enrique Chacón, Pedro Tarazona and Ricardo Garcia Interfacial water on collagen nanoribbons by 3D AFM
Journal of Chemical Physics 160, 164714 (2024)
DOI: https://doi.org/10.1063/5.0205611
The article “Interfacial water on collagen nanoribbons by 3D AFM” by Diana M. Arvelo, Clara Garcia-Sacristan, Enrique Chacón, Pedro Tarazona and Ricardo Garcia is licensed under a Creative Commons Attribution 4.0 International License, which permits use, sharing, adaptation, distribution and reproduction in any medium or format, as long as you give appropriate credit to the original author(s) and the source, provide a link to the Creative Commons license, and indicate if changes were made. The images or other third-party material in this article are included in the article’s Creative Commons license, unless indicated otherwise in a credit line to the material. If material is not included in the article’s Creative Commons license and your intended use is not permitted by statutory regulation or exceeds the permitted use, you will need to obtain permission directly from the copyright holder. To view a copy of this license, visit https://creativecommons.org/licenses/by/4.0/.