Lateral Piezoelectricity of Alzheimer‘s Aβ Aggregates

Alzheimer’s disease (AD) is the most frequent neurodegenerative disorder in the elderly aged over 65.*

The extracellular accumulation of beta-amyloid (Aβ) aggregates in the brain is considered as the major event worsening the AD symptoms, but its underlying reason has remained unclear.

In the article „Lateral Piezoelectricity of Alzheimer‘s Aβ Aggregates“ by Jinhyeong Jang, Soyun Joo, Jiwon Yeom, Yonghan Jo, Jingshu Zhang, Seungbum Hong and Chan Beum Park the piezoelectric characteristics of Aβ aggregates are revealed.

The vector piezoresponse force microscopy (PFM) analysis results exhibit that Aβ fibrils have spiraling piezoelectric domains along the length and a lateral piezoelectric constant of 44.1 pC N-1. Also, the continuous sideband Kelvin probe force microscopy (KPFM) images display that the increment of charge-induced surface potential on a single Aβ fibril is allowed to reach above +1700 mV in response to applied forces.

These findings shed light on the peculiar mechano-electrical surface properties of pathological Aβ fibrils that exceed those of normal body components.*

Both KPFM and nanoindentation measurements were performed using a chemically inert conductive diamond AFM tip. (NanoWorld Pointprobe CDT-FMR).

Vertical and lateral PFM images of Aβ fibrils were obtained by scanning probe microscopy with a platinum/iridium-coated silicon cantilever ( NanoWorld Pointprobe® CONTPt ). The scanning angle of the PFM cantilever was set to zero, with scan rate of 0.5 Hz and loading force of 10 nN. This setup minimized electrostatic contributions to the torsional movement of the tip, allowing measurements to focus on the shear electromechanical effects of Aβ fibrils. Vertical and lateral drive frequencies were 53 kHz and 309 kHz, respectively.*
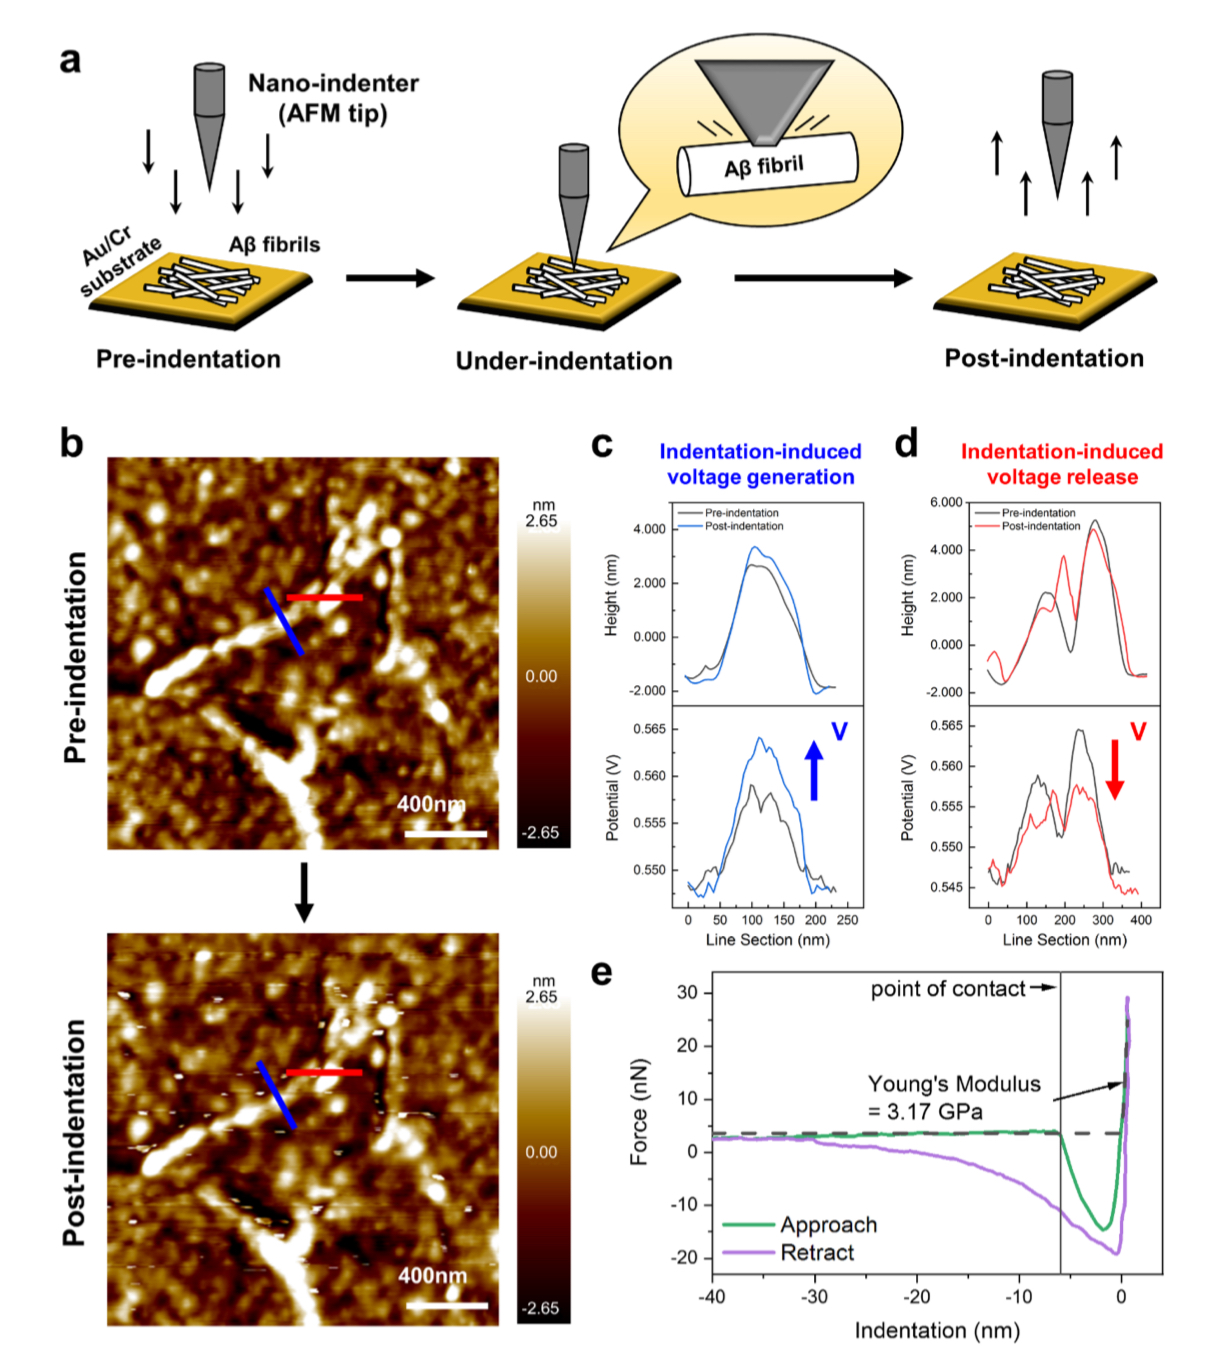
Figure S10 from „Lateral Piezoelectricity of Alzmeiner‘s Aβ Aggregates by Jinhyeong Jang et al.:
Nanoindentation test result of Aβ fibrils. Direct piezoelectric effects are tested by measuring the surface potential change before and after nano-indentation of Aβ fibrils.
(A) Schematic illustration of the nanoindentation test for Aβ fibrils coated on an Au/Cr substrate.
(B) Topgraphy of Aβ fibrils acquired before and after applying nanoindentation. The post-indentation image shows white spots resulting from physical interactions between the AFM tip and the sample, while the approximate structure of the Aβ fibrils remains intact. Height and potential line sections obtained fom the (c) blue and (d) red lines are shown in the topgraphy of Aβ fibrils. The height remains unchanged, while electrical voltage increment and decrement were observed at the blue and red lines, respectively.
(D) During the nanoindentation the Young‘s modulus of Aβ – fibrils was measured to be 3.17 GPa, closely approxmating the literature (Nanoscale 4, 4426-4429 (2012). Both KPFM and nanoindentation measurements were performed using a chemically inert conductive diamond AFM tip (CDT-FMR, NanoWorld, Switzerland). Collected force curves were analyzed using the Hertz model to estimate the elastic moduli.

*Jinhyeong Jang, Soyun Joo, Jiwon Yeom, Yonghan Jo, Jingshu Zhang, Seungbum Hong and Chan Beum Park
Lateral Piezoelectricity of Alzheimer‘s Aβ Aggregates
Advanced Science, Volume 11, Issue 39, October 024, 2406678
DOI: https://doi.org/10.1002/advs.202406678

Open Access The article “Lateral Piezoelectricity of Alzheimer‘s Aβ Aggregates” byJinhyeong Jang, Soyun Joo, Jiwon Yeom, Yonghan Jo, Jingshu Zhang, Seungbum Hong and Chan Beum Park is licensed under a Creative Commons Attribution 4.0 International License, which permits use, sharing, adaptation, distribution and reproduction in any medium or format, as long as you give appropriate credit to the original author(s) and the source, provide a link to the Creative Commons license, and indicate if changes were made. The images or other third party material in this article are included in the article’s Creative Commons license, unless indicated otherwise in a credit line to the material. If material is not included in the article’s Creative Commons license and your intended use is not permitted by statutory regulation or exceeds the permitted use, you will need to obtain permission directly from the copyright holder. To view a copy of this license, visit http://creativecommons.org/licenses/by/4.0/.

Influence of B/N co-doping on electrical and photoluminescence properties of CVD grown homoepitaxial diamond films

Boron doped diamond (BDD) has great potential in electrical, and electrochemical sensing applications. The growth parameters, substrates, and synthesis method play a vital role in the preparation of semiconducting BDD to metallic BDD. Doping of other elements along with boron (B) into diamond demonstrated improved efficacy of B doping and exceptional properties.*

In the article “Influence of B/N co-doping on electrical and photoluminescence properties of CVD grown homoepitaxial diamond films” Srinivasu Kunuku, Mateusz Ficek, Aleksandra Wieloszynska, Magdalena Tamulewicz-Szwajkowska, Krzysztof Gajewski, Miroslaw Sawczak, Aneta Lewkowicz, Jacek Ryl, Tedor Gotszalk and Robert Bogdanowicz describe how B and nitrogen (N) co-doped diamond has been synthesized on single crystalline diamond (SCD) IIa and SCD Ib substrates in a microwave plasma-assisted chemical vapor deposition process.*

The surface topography of the CVD diamond layers was investigated using atomic force microscopy (AFM), and Kelvin probe force microscopy (KPFM) was employed to measure the contact potential difference (CPD) to calculate the work function of these CVD diamond layers.*

Atomic force microscopy topography depicted the flat and smooth surface with low surface roughness for low B doping, whereas surface features like hillock structures and un-epitaxial diamond crystals with high surface roughness were observed for high B doping concentrations. KPFM measurements revealed that the work function (4.74–4.94 eV) has not varied significantly for CVD diamond synthesized with different B/C concentrations.*

NanoWorld ARROW-EFM conductive platinumirdidium5 coated AFM probes with a typical spring constant of 2.8 N/m and a typical resonant frequency of 75 kHz were used.*

Figure 2 from “Influence of B/N co-doping on electrical and photoluminescence properties of CVD grown homoepitaxial diamond films “ by Srinivasu Kunuku et al: AFM topography of B/N co-doped CVD diamond on (with fixed N/C = 0.02) SCD IIa; (a) B/C ∼ 2500 ppm (b) B/C ∼ 5000 ppm (c) B/C ∼ 7500 ppm, and KPFM CPD images of B/N co-doped CVD diamond (with fixed N/C = 0.02) on SCD IIa; (d) B/C ∼ 2500 ppm (e) B/C ∼ 5000 ppm (f) B/C ∼ 7500 ppm. NanoWorld Arrow-EFM platinumiridium coated AFM probes were used for the KPFM and surface topography measurements.
Figure 2 from “Influence of B/N co-doping on electrical and photoluminescence properties of CVD grown homoepitaxial diamond films “ by Srinivasu Kunuku et al:
AFM topography of B/N co-doped CVD diamond on (with fixed N/C = 0.02) SCD IIa; (a) B/C ∼ 2500 ppm (b) B/C ∼ 5000 ppm (c) B/C ∼ 7500 ppm, and KPFM CPD images of B/N co-doped CVD diamond (with fixed N/C = 0.02) on SCD IIa; (d) B/C ∼ 2500 ppm (e) B/C ∼ 5000 ppm (f) B/C ∼ 7500 ppm.

*Srinivasu Kunuku, Mateusz Ficek, Aleksandra Wieloszynska, Magdalena Tamulewicz-Szwajkowska, Krzysztof Gajewski, Miroslaw Sawczak, Aneta Lewkowicz, Jacek Ryl, Tedor Gotszalk and Robert Bogdanowicz
Influence of B/N co-doping on electrical and photoluminescence properties of CVD grown homoepitaxial diamond films
Nanotechnology (2022),  33 125603
DOI: https://doi.org/10.1088/1361-6528/ac4130

Please follow this external link to read the full article: https://doi.org/10.1088/1361-6528/ac4130

Open Access The article “Influence of B/N co-doping on electrical and photoluminescence properties of CVD grown homoepitaxial diamond films” by Srinivasu Kunuku, Mateusz Ficek, Aleksandra Wieloszynska, Magdalena Tamulewicz-Szwajkowska, Krzysztof Gajewski, Miroslaw Sawczak, Aneta Lewkowicz, Jacek Ryl, Tedor Gotszalk and Robert Bogdanowicz is licensed under a Creative Commons Attribution 4.0 International License, which permits use, sharing, adaptation, distribution and reproduction in any medium or format, as long as you give appropriate credit to the original author(s) and the source, provide a link to the Creative Commons license, and indicate if changes were made. The images or other third party material in this article are included in the article’s Creative Commons license, unless indicated otherwise in a credit line to the material. If material is not included in the article’s Creative Commons license and your intended use is not permitted by statutory regulation or exceeds the permitted use, you will need to obtain permission directly from the copyright holder. To view a copy of this license, visit http://creativecommons.org/licenses/by/4.0/.

Quantification of electron accumulation at grain boundaries in perovskite polycrystalline films by correlative infrared-spectroscopic nanoimaging and Kelvin probe force microscopy

Organic-inorganic halide perovskites are materials of high interest for the development of solar cells.

Learning more about the relationship between the electrical properties and the chemical compositions of perovskite at the nanoscale can help to understand how the interrelations of both can affect device performance and contribute to an understanding on how to best design perovskite active layer structures.*

For the article “Quantification of electron accumulation at grain boundaries in perovskite polycrystalline films by correlative infrared-spectroscopic nanoimaging and Kelvin probe force microscopy” Ting-Xiao Qin, En-Ming You, Mao-Xin Zhang, Peng Zheng, Xiao-Feng Huang, Song-Yuan Ding, Bing-Wei Mao and Zhong-Qun Tian used correlative infrared-spectroscopic nanoimaging ( IR-spectroscopy ) by scattering-type scanning near-field optical microscopy ( s-SNOM ) and Kelvin probe force microscopy ( KPFM ) to contribute to the discussion whether nanometer-sized grain boundaries (GBs) in polycrystalline perovskite films play a positive or negative role in solar cell performance.*

The integrated KPFM and s-SNOM measurements were performed by the authors to acquire the surface potential and infrared near-field image simultaneously through a single-pass scan and thereby learn more about the relationships between the electrical properties and spectral information at the grain boundaries of the investigated material ( polycrystalline CH3NH3Pbl3 perovskite films ).*

The results of the correlated s-SNOM and KPFM imaging presented in the article show that the electron accumulations are enhanced at the grain boundaries (GBs) of the investigated polycrystalline perovskite film, particularly under light illumination which would assist in electron-hole separation and therefore would be a positive influence on the performance of the solar cell.*

NanoWorld conductive platinum-iridium coated Arrow AFM probes ( Arrow-NCPt ) were used to perform the s-SNOM IR imaging.

Figure 4 from “Quantification of electron accumulation at grain boundaries in perovskite polycrystalline films by correlative infrared-spectroscopic nanoimaging and Kelvin probe force microscopy” by Ting-Xiao Qin  et al.
Correlative KPFM and s-SNOM nanoimaging on perovskite.
a AFM topography (1 μm × 1 μm); b Contact potential difference (CPD); and c simultaneously acquired infrared near-field image; d one-dimensional line profiles of the topography, CPD and infrared near-field amplitude along the white dashed lines marked in a–c. The scale bars are 200 nm.
NanoWorld Arrow-NCPt AFM probes were used to perform the s-SNOM IR imaging
Figure 4 from “Quantification of electron accumulation at grain boundaries in perovskite polycrystalline films by correlative infrared-spectroscopic nanoimaging and Kelvin probe force microscopy” by Ting-Xiao Qin  et al.
Correlative KPFM and s-SNOM nanoimaging on perovskite.
a AFM topography (1 μm × 1 μm); b Contact potential difference (CPD); and c simultaneously acquired infrared near-field image; d one-dimensional line profiles of the topography, CPD and infrared near-field amplitude along the white dashed lines marked in a–c. The scale bars are 200 nm.

*Ting-Xiao Qin, En-Ming You, Mao-Xin Zhang, Peng Zheng, Xiao-Feng Huang, Song-Yuan Ding, Bing-Wei Mao and Zhong-Qun Tian
Quantification of electron accumulation at grain boundaries in perovskite polycrystalline films by correlative infrared-spectroscopic nanoimaging and Kelvin probe force microscopy
Light: Science & Applications volume 10, Article number: 84 (2021)
DOI: https://doi.org/10.1038/s41377-021-00524-7

Please follow the external link to read the whole article: https://rdcu.be/clg7f

Open Access : The article “Quantification of electron accumulation at grain boundaries in perovskite polycrystalline films by correlative infrared-spectroscopic nanoimaging and Kelvin probe force microscopy” by Ting-Xiao Qin, En-Ming You, Mao-Xin Zhang, Peng Zheng, Xiao-Feng Huang, Song-Yuan Ding, Bing-Wei Mao and Zhong-Qun Tian is licensed under a Creative Commons Attribution 4.0 International License, which permits use, sharing, adaptation, distribution and reproduction in any medium or format, as long as you give appropriate credit to the original author(s) and the source, provide a link to the Creative Commons license, and indicate if changes were made. The images or other third party material in this article are included in the article’s Creative Commons license, unless indicated otherwise in a credit line to the material. If material is not included in the article’s Creative Commons license and your intended use is not permitted by statutory regulation or exceeds the permitted use, you will need to obtain permission directly from the copyright holder. To view a copy of this license, visit https://creativecommons.org/licenses/by/4.0/.