Local probing of the nanoscale hydration landscape of kaolinite basal facets in the presence of ions

Kaolinite is one of the most abundant natural clay minerals within soils at the Earth’s surface and within rock units in the upper crust. *

The interface between aqueous solutions and the facets of kaolinite plays an important role in a wide range of technological applications including tribology, paper production, oil recovery, waste water treatment and medical devices. *

This is made possible by kaolinite’s layered structure, with its two basal surfaces -aluminol and siloxane-exhibiting different properties and reactivity. *

Both macroscopic and nanoscale studies point to a strong dependence of kaolinite’s surface properties on its local hydration structure. No experimental results, however, have systematically and comparatively investigated the hydration landscape of both basal facets to date. *

In the article “Local probing of the nanoscale hydration landscape of kaolinite basal facets in the presence of ions”  Clodomiro Cafolla, Tai Bui, Tran Thi Bao Le, Andrea Zen, Weparn J. Tay, Alberto Striolo, Angelos Michaelides, Hugh Christopher Greenwell and Kislon Voïtchovsky combine high-resolution atomic force microscopy (AFM) imaging and force spectroscopy with classical molecular dynamics (MD) simulations to illustrate key differences in the hydration behaviour of the aluminol and siloxane facets of kaolinite particles immersed in water and NaCl solutions. *

This combined approach allows the authors to overcome the limitations of each technique via the advantages of the other. Specifically, AFM images highlight the differences in the first hydration layer of each facet and serve as a basis for force spectroscopy measurements of the full hydration profile at a given location. *

Water densities extracted from MD help interpret the AFM results, both in the absence and in the presence of added Na+ ions. *

Complementary AFM spectroscopy measurements show an excellent agreement between the conservative component and MD’s water density profiles, with discrete hydration layers on both facets and little sensitivity to added ions. *

The dissipative component of the measured AFM tip-sample interactions is more sensitive to the presence of ions, with MD suggesting a link with the local water dynamics and transient instabilities between stable hydration layers. *

These effects are facet-dependant and more pronounced on the aluminol facet where the first water layer is better defined. Increasing the salt concentration allows hydrated ions to form more stable layers, with hints of organised ionic domains. *

The results provide unique insights into both the equilibrium molecular structure and dynamics of the kaolinite facets, potentially informing applications involving interfacial processes. *

The AFM experiments were conducted at 25 ± 0.1 °C using a commercial atomic force microscope equipped with temperature control.
NanoWorld Arrow-UHF silicon AFM probes were used.
The AFM cantilevers were thoroughly washed with pure water (20 times with 100 μl) and then with the solution of interest (40 times with 100 μl).
Experiments were performed at near neutral pH 5.8. This ensured that only the metal ions of interest were present on the AFM cantilever. Thorough cleaning procedures were implemented to avoid any possible sources of contamination. *

During the measurements, the AFM cantilever and the sample were fully immersed in the aqueous ionic solution of interest. The thermal spectrum of the AFM cantilever was used to perform the flexural calibration of the AFM cantilevers. The AFM probes were found to have a flexural spring constant in the range 1.0–4.0 N/m and a resonance frequency of ∼400–900 kHz in water. These values agree with the nominal range and the literature. The AFM cantilever oscillation was photo-thermally driven to ensure greater stability, making sure that the frequency response remained unaffected by any spurious contributions due to the noise produced by mechanical coupling with other experimental components of the system. *

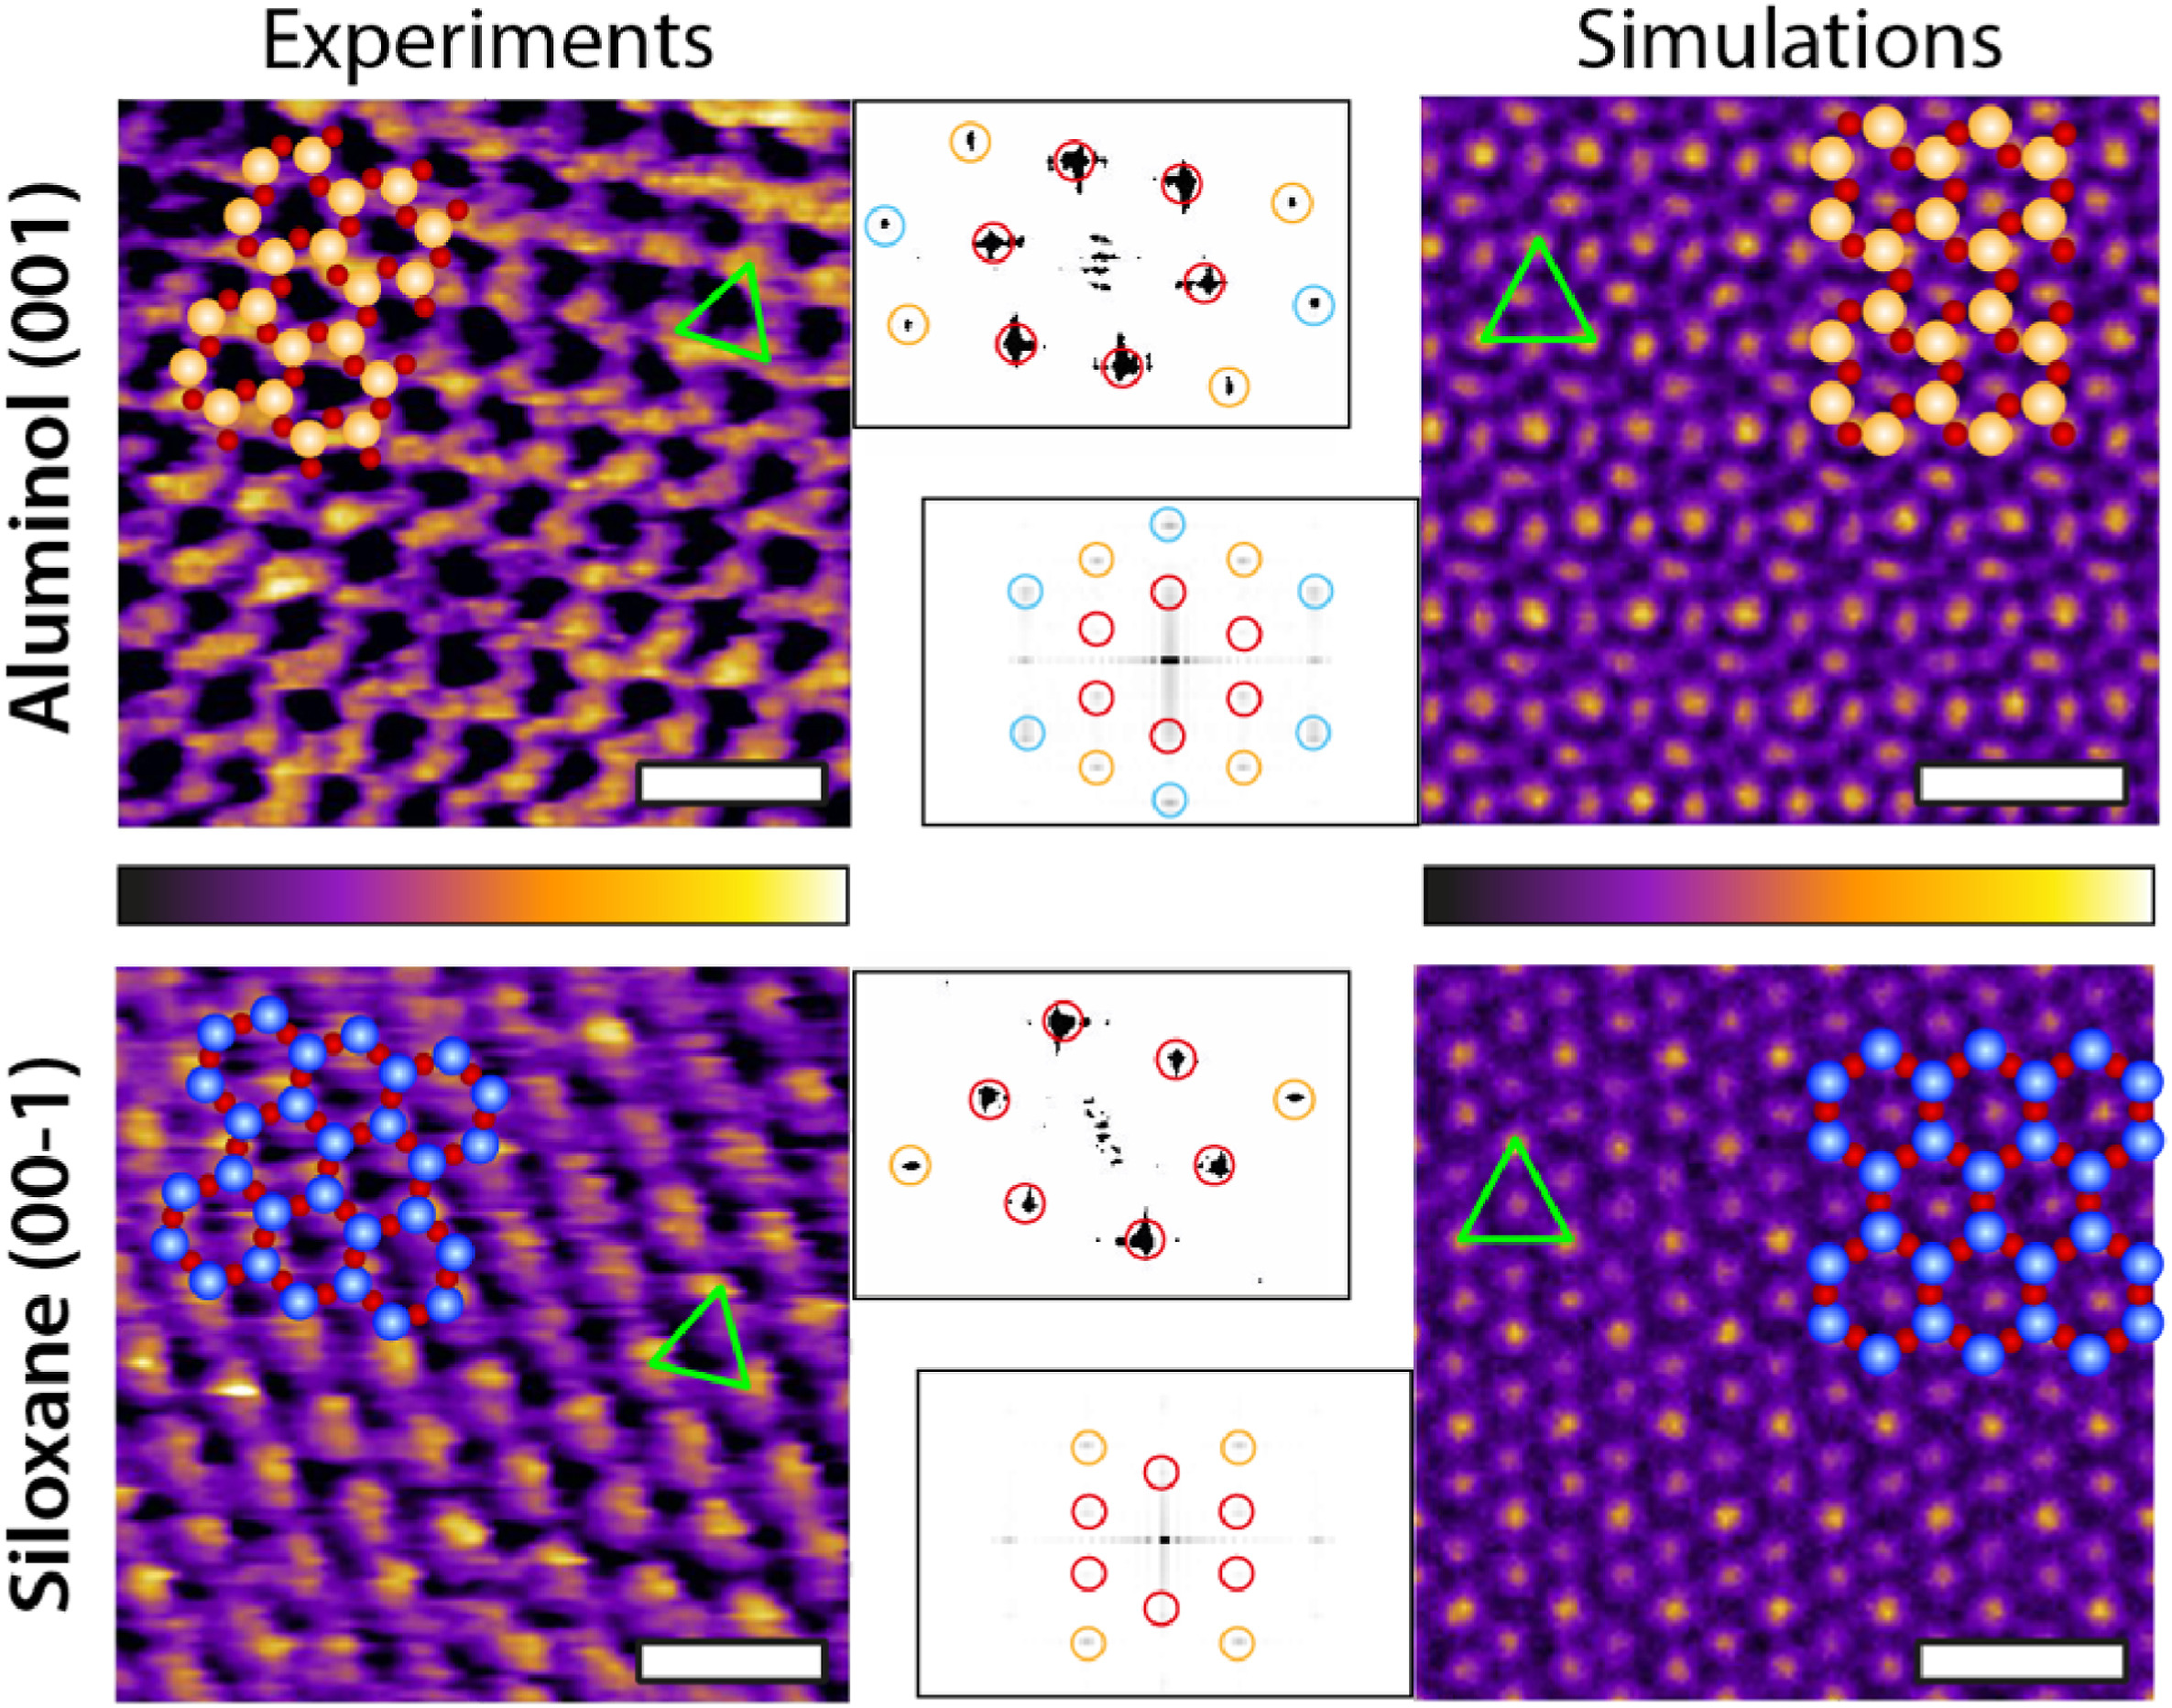
Fig. 2 from Clodomiro Cafolla et al. 2024 “Local probing of the nanoscale hydration landscape of kaolinite basal facets in the presence of ions”:Representative experimental (AFM) and computational (MD) images of both kaolinite facets. For each image, the corresponding atomic arrangement of the facet is superimposed to scale. The green triangle highlights the brightest periodic features appearing in both AFM and MD, showing a good agreement. The MD images represent the density distribution of the first hydration layer over each facet. The insets show the Fast Fourier Transform (FFT) of each image and highlight the first (red), second (orange) and third (cyan) order intensity peaks. The MD results represent a 2D projection for the water oxygen density in the first hydration layer averaged over 3 ns. The scale bar represents 1 nm. The AFM colour scale bar represents a height variation of ∼0.3 nm; the MD colour scale is based on a density range at a fixed height (first hydration layer). (For interpretation of the references to colour in this figure legend, the reader is referred to the Web version of this article.) NanoWorld Arrow-UHF silicon AFM probes were used.
Fig. 2 from Clodomiro Cafolla et al. 2024 “Local probing of the nanoscale hydration landscape of kaolinite basal facets in the presence of ions”:
Representative experimental (AFM) and computational (MD) images of both kaolinite facets. For each image, the corresponding atomic arrangement of the facet is superimposed to scale. The green triangle highlights the brightest periodic features appearing in both AFM and MD, showing a good agreement. The MD images represent the density distribution of the first hydration layer over each facet. The insets show the Fast Fourier Transform (FFT) of each image and highlight the first (red), second (orange) and third (cyan) order intensity peaks. The MD results represent a 2D projection for the water oxygen density in the first hydration layer averaged over 3 ns. The scale bar represents 1 nm. The AFM colour scale bar represents a height variation of ∼0.3 nm; the MD colour scale is based on a density range at a fixed height (first hydration layer). (For interpretation of the references to colour in this figure legend, the reader is referred to the Web version of this article.)

*Clodomiro Cafolla, Tai Bui, Tran Thi Bao Le, Andrea Zen, Weparn J. Tay, Alberto Striolo, Angelos Michaelides, Hugh Christopher Greenwell and Kislon Voïtchovsky
Local probing of the nanoscale hydration landscape of kaolinite basal facets in the presence of ions
Materials Today Physics, Volume 46, August 2024, 101504
DOI: https://doi.org/10.1016/j.mtphys.2024.101504

Open Access The article “Local probing of the nanoscale hydration landscape of kaolinite basal facets in the presence of ions” by Clodomiro Cafolla, Tai Bui, Tran Thi Bao Le, Andrea Zen, Weparn J. Tay, Alberto Striolo, Angelos Michaelides, Hugh Christopher Greenwell and Kislon Voïtchovsky is licensed under a Creative Commons Attribution 4.0 International License, which permits use, sharing, adaptation, distribution and reproduction in any medium or format, as long as you give appropriate credit to the original author(s) and the source, provide a link to the Creative Commons license, and indicate if changes were made. The images or other third party material in this article are included in the article’s Creative Commons license, unless indicated otherwise in a credit line to the material. If material is not included in the article’s Creative Commons license and your intended use is not permitted by statutory regulation or exceeds the permitted use, you will need to obtain permission directly from the copyright holder. To view a copy of this license, visit http://creativecommons.org/licenses/by/4.0/.

Real-time multistep asymmetrical disassembly of nucleosomes and chromatosomes visualized by high-speed atomic force microscopy

During replication, expression, and repair of the eukaryotic genome, cellular machinery must access the DNA wrapped around histone proteins forming nucleosomes. These octameric protein·DNA complexes are modular, dynamic, and flexible and unwrap or disassemble either spontaneously or by the action of molecular motors. Thus, the mechanism of formation and regulation of subnucleosomal intermediates has gained attention genome-wide because it controls DNA accessibility.*

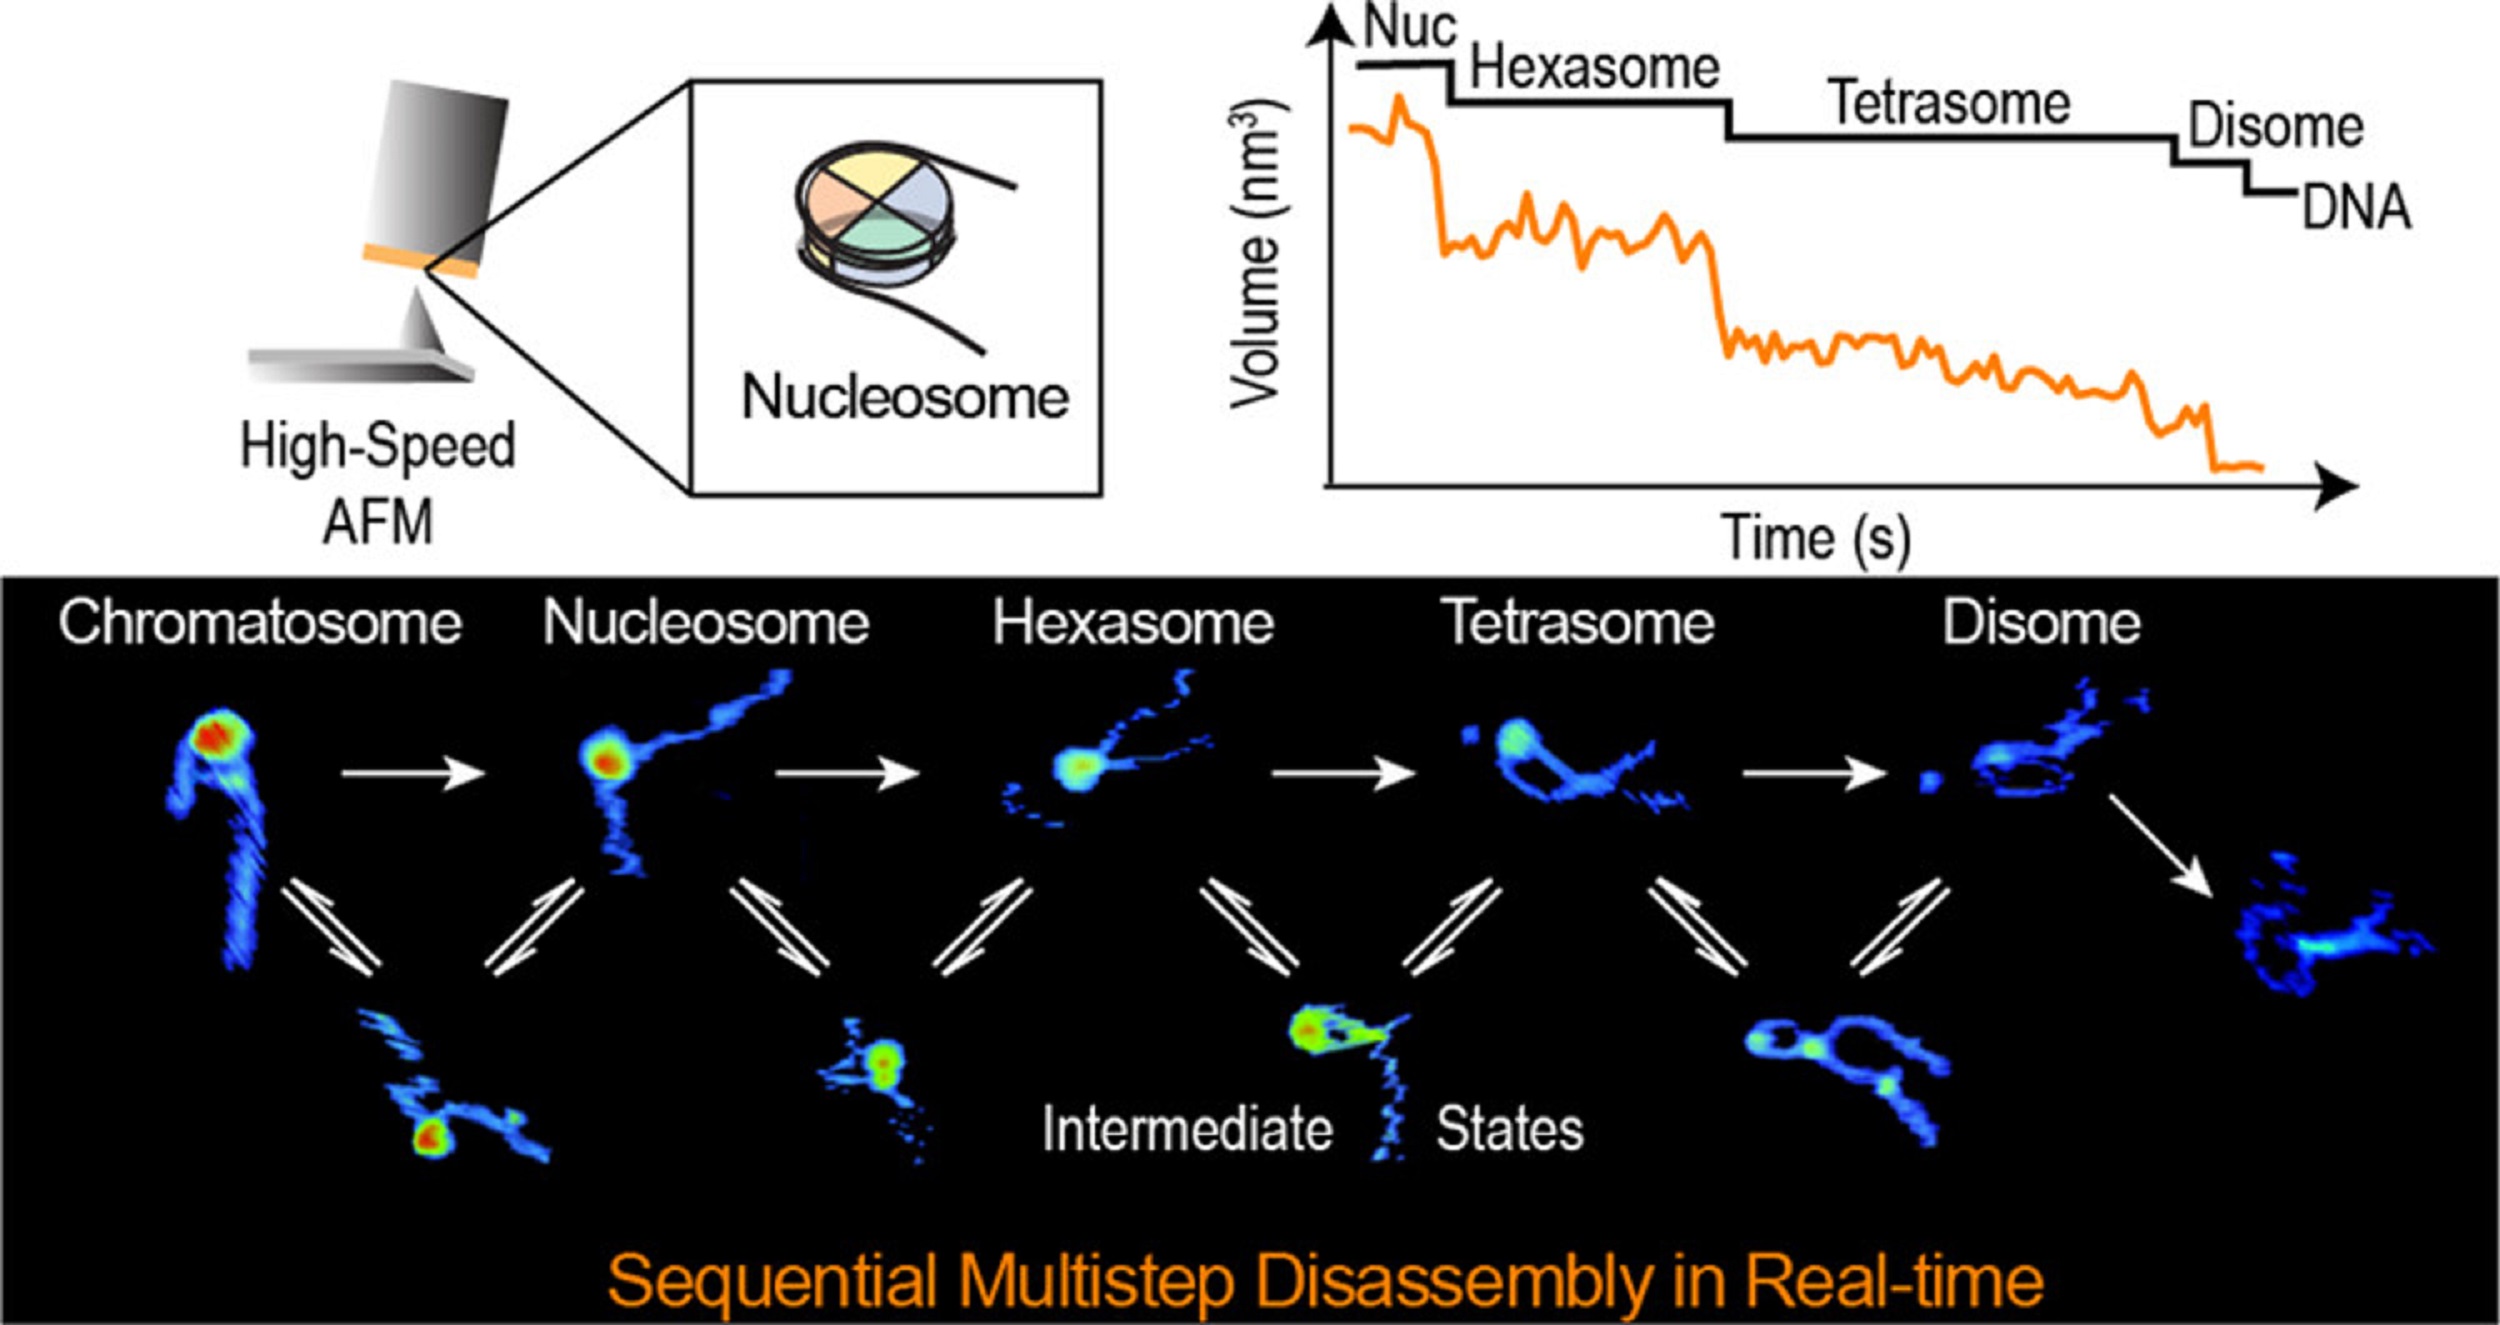
In the article  “Real-Time Multistep Asymmetrical Disassembly of Nucleosomes and Chromatosomes Visualized by High-Speed Atomic Force Microscopy” Bibiana Onoa, César Díaz-Celis, Cristhian Cañari-Chumpitaz, Antony Lee and Carlos Bustamante describe how they imaged nucleosomes and their more compacted structure with the linker histone H1 (chromatosomes) using high-speed atomic force microscopy to visualize simultaneously the changes in the DNA and the histone core during their disassembly when deposited on mica.*

Furthermore, Bibiana Onoa et al. trained a neural network and developed an automatic algorithm to track molecular structural changes in real time. *

The authors’ results show that nucleosome disassembly is a sequential process involving asymmetrical stepwise dimer ejection events. The presence of H1 restricts DNA unwrapping, significantly increases the nucleosomal lifetime, and affects the pathway in which heterodimer asymmetrical dissociation occurs. *

Bibiana Onoa et al.  observe that tetrasomes are resilient to disassembly and that the tetramer core (H3·H4)2 can diffuse along the nucleosome positioning sequence. Tetrasome mobility might be critical to the proper assembly of nucleosomes and can be relevant during nucleosomal transcription, as tetrasomes survive RNA polymerase passage. These findings are relevant to understanding nucleosome intrinsic dynamics and their modification by DNA-processing enzymes. *

To characterize the nucleosomes dynamics in 2D, individual molecules were observed in buffer using an Ando-type high speed atomic force microscope together with NanoWorld Ultra-Short Cantilevers for HS-AFM of the USC-F1.2-K0.15 AFM probe type ( typical spring constant 0.15 N/m, typical resonance frequency in air 1200 kHz, resonance frequency 500–600 kHz in liquid). *

The AFM data presented in the article allow the authors to directly visualize the dynamics of DNA and histones during nucleosome and chromatosome disassembly, providing a simultaneous observation of DNA unwrapping and histone dissociation. *

The experimental and analytical strategy presented shows that real-time HS-AFM is a robust and powerful tool for studying single nucleosomes and chromatin dynamics. *

graphical abstract from Bibiana Onoa et al 2024 "Real-Time Multistep Asymmetrical Disassembly of Nucleosomes and Chromatosomes Visualized by High-Speed Atomic Force Microscopy" - NanoWorld Ultra-Short Cantilevers of the USC-F1.2-k0.15 AFM probe type were used for the high-speed atomic force microscopy
graphical abstract from Bibiana Onoa et al 2024 “Real-Time Multistep Asymmetrical Disassembly of Nucleosomes and Chromatosomes Visualized by High-Speed Atomic Force Microscopy”

*Bibiana Onoa, César Díaz-Celis, Cristhian Cañari-Chumpitaz, Antony Lee and Carlos Bustamante
Real-Time Multistep Asymmetrical Disassembly of Nucleosomes and Chromatosomes Visualized by High-Speed Atomic Force Microscopy
ACS Central Science 2024, 10, 1, 122–137
DOI: https://doi.org/10.1021/acscentsci.3c00735

Open Access The article “Real-Time Multistep Asymmetrical Disassembly of Nucleosomes and Chromatosomes Visualized by High-Speed Atomic Force Microscopy” by Bibiana Onoa, César Díaz-Celis, Cristhian Cañari-Chumpitaz, Antony Lee and Carlos Bustamante is licensed under a Creative Commons Attribution 4.0 International License, which permits use, sharing, adaptation, distribution and reproduction in any medium or format, as long as you give appropriate credit to the original author(s) and the source, provide a link to the Creative Commons license, and indicate if changes were made. The images or other third party material in this article are included in the article’s Creative Commons license, unless indicated otherwise in a credit line to the material. If material is not included in the article’s Creative Commons license and your intended use is not permitted by statutory regulation or exceeds the permitted use, you will need to obtain permission directly from the copyright holder. To view a copy of this license, visit http://creativecommons.org/licenses/by/4.0/.
Interfacial water on collagen nanoribbons by 3D AFM

Collagen is the most abundant structural protein in mammals. *

Type I collagen in its fibril form has a characteristic pattern structure that alternates two regions called gap and overlap. The structure and properties of collagens are highly dependent on the water and mineral content of the environment. *

In the article “Interfacial water on collagen nanoribbons by 3D AFM” Diana M. Arvelo, Clara Garcia-Sacristan, Enrique Chacón, Pedro Tarazona and Ricardo Garcia describe how they apply three dimensional atomic force microscopy (3D AFM) to characterize at angstrom-scale resolution the interfacial water structure of collagen nanoribbons.*

Three-dimensional AFM (3D AFM) is an AFM method developed for imaging at high-spatial resolution solid–liquid interfaces in the three spatial coordinates.*

This method has provided atomic-scale images of hydration and solvation layers on a variety of rigid and atomically flat surfaces, such as mica, gibbsite, boehmite, graphite, or 2D materials.*

However, imaging hydration layers on soft materials such as collagen is more challenging than on atomically flat crystalline surfaces.*

On the one hand, the force applied by the AFM tip might deform the protein. On the other hand, the height variations across gap and overlap regions might complicate the imaging of interfacial water.*

In recent years, 3D AFM has expanded its capabilities to image interfacial water on soft materials such as proteins, biopolymers, DNA, lipids, membrane proteins, and cells.*

Those experiments were performed with hydrophilic SiOx AFM tips which are negatively charged under neutral pH conditions.*

The imaging contrast mechanisms and the role of the AFM tip’s composition on the observed solvation structure are under discussion.*

More generally, both theory and experiments performed with very high salt concentrations indicated that the contrast observed in 3D AFM reflects an interplay between water particle and surface charge density distributions.*

For their article the authors apply 3D AFM to study at molecular-scale spatial resolution the structure of interfacial water on collagen nanoribbons.*

Diana M. Arvelo et al. study the influence of the AFM tip’s charge and the salt concentration on the interfacial solvent structure. They report that the interfacial structure depends on the water particle and ion charge density distributions. A non-charged AFM tip reveals the formation of hydration layers on both gap and overlap regions. A negatively charged AFM tip shows that on a gap region, the solvation structure might depart from that of the hydration layers. This effect is attributed to the adsorption of ions from the solution. Those ions occupy the voids existing between collagen molecules in the gap region. *

A home-made three-dimensional AFM was implemented on a commercially available AFM. 3D AFM was performed in the amplitude modulation mode by exciting the AFM cantilever at its first eigenmode.
At the same time when the AFM cantilever oscillates with respect to its equilibrium position, a sinusoidal signal is applied to the z-piezo to modify the relative z-distance between the sample and the AFM tip. *

Diana M. Arvelo et al. have used z-piezo displacements with amplitudes of 2.0 nm and a period (frequency) of 10 ms (100 Hz). The z-piezo signal is synchronized with the xy-displacements in such a way that for each xy-position on the surface of the material, the AFM tip performs a single and complete z-cycle. The z-data are read out every 10.24 µs and stored in 512 pixels (256 pixels per half cycle). Each xy-plane of the 3D map contains 80 × 64 pixels. Hence, the total time to acquire such a 3D-AFM image is 52 s.*

The 3D AFM experiments were performed with two types of AFM probes with different surface chemistries which have different chemical properties in aqueous solutions.*

The high-density carbon/diamond-like AFM tips grown on quartz-like AFM cantilevers that Diana M. Arvelo et al. et al used ( NanoWorld Ultra-Short Cantilevers USC-F1.2-k7.3 for high-speed AFM) remain uncharged at pH 7.4 and are called “neutral” AFM tips in the article.

The silicon AFM cantilevers with silicon AFM tips (NanoWorld Arrow-UHFAuD ultra-high frequency AFM probes) are negatively charged at neutral pH (silicon tips for short in the text) and were used to observe the formation of collagen nanoribbons.

All silicon AFM tips are readily oxidized and are usually covered by a thin native oxide layer which is hydrophilic.

The hydroxyl groups on the surface of the silicon AFM tip become negatively charged while the carbon AFM tips remain neutral (unchanged).

To image at angstrom-scale resolution, the interfacial water structure on the collagen requires reducing the lateral and vertical imaging sizes, respectively, to 5 and 1.5 nm.*

First, the authors introduce the results obtained with carbon-based tips (uncharged, NanoWorld Ultra-Short Cantilevers USC-F1.2-k7.3 for high-speed AFM). Figure 2 (of the cited article) shows some representative 2D force xz panels obtained on gap and overlap regions of a collagen nanoribbon in a concentration of 300 mM KCl. The panels are extracted from a 3D AFM image. The interlayer distances in a gap region are d1 = 0.28 nm and d2 = 0.33 nm (average values) [Fig. 2(a)], while those in an overlap region are d1 = 0.29 and d2 = 0.32 nm (average values) [Fig. 2(b)]. Those values coincide within the experimental error with the values expected for hydration layers on hydrophilic surfaces.

Next, the authors repeated the experiment using other salt concentrations. Figure 2(c) shows that the interlayers distances (within the experimental error) do not depend on the salt concentration or the collagen region. Diana M. Arvelo et al.  remark that entropic effects make the second layer more disordered than the first; therefore, d2 ≥ d1.

The structure and properties of collagens are highly dependent on the water and mineral content of the environment.

For a neutral AFM tip (USC-F1.2-k7.3), the interfacial water structure is characterized by the oscillation of the water particle density distribution with a value of 0.3 nm (hydration layers). The interfacial structure does not depend on the collagen region.

For a negatively charged AFM tip (NanoWorld Arrow-UHFAuD ultra-high frequency AFM probes) the interfacial structure might depend on the collagen region.

Hydration layers are observed in overlap regions, while in gap regions, the interfacial solvent structure is dominated by electrostatic interactions. These interactions generate interlayer distances of 0.2 nm.

The achieved results still need to be explained by the theory of 3D AFM. More detailed theoretical simulations, which are beyond the scope of the cited study, will be required to quantitatively explain the interlayer distances observed over gap regions.

However, the results presented by the authors highlight the potential of 3D AFM to identify the solvent structures on proteins and the complexity of those interfaces.*

Figure 2 from Diana M. Arvelo et al. 2024 “Interfacial water on collagen nanoribbons by 3D AFM”Interfacial liquid water structure on collagen provided by an uncharged tip. (a) 2D force maps (x, y) of the interfacial water structure in the gap region. The map is obtained in a 300 mM KCl solution. The force–distance curves in the bottom of the image are obtained from the top panel. (b) 2D force maps (x, y) of the interfacial water structure in the overlap region. The force–distance curves in the bottom of the image are obtained from the top panel. (c) Statistics of d1 and d2 distances measured from several collagen–water interfaces. The individual force–distance curves from the bottom panels of (a) and (b) are plotted in gray. The average force–distance curve is highlighted by a thick continuous line. The experiments are performed with USC-F1.2-k7.3 cantilevers. Experimental parameters: f = 745 kHz; k = 6.7 N m−1; Q = 8.3; A0 = 150 pm; Asp = 100 pm. The neutral AFM tips used for the research in this article were NanoWorld Ultra-Short Cantilevers USC-F1.2-k7.3 for high-speed AFM (quartz-like AFM cantilevers with a high-density carbon AFM tip grown on them)
Figure 2 from Diana M. Arvelo et al. 2024 “Interfacial water on collagen nanoribbons by 3D AFM”
Interfacial liquid water structure on collagen provided by an uncharged tip. (a) 2D force maps (x, y) of the interfacial water structure in the gap region. The map is obtained in a 300 mM KCl solution. The force–distance curves in the bottom of the image are obtained from the top panel. (b) 2D force maps (x, y) of the interfacial water structure in the overlap region. The force–distance curves in the bottom of the image are obtained from the top panel. (c) Statistics of d1 and d2 distances measured from several collagen–water interfaces. The individual force–distance curves from the bottom panels of (a) and (b) are plotted in gray. The average force–distance curve is highlighted by a thick continuous line. The experiments are performed with USC-F1.2-k7.3 cantilevers. Experimental parameters: f = 745 kHz; k = 6.7 N m−1; Q = 8.3; A0 = 150 pm; Asp = 100 pm.


Figure 3 from Diana M. Arvelo et al. 2024 “Interfacial water on collagen nanoribbons by 3D AFM”Interfacial liquid water structure on collagen provided by a negatively charged tip. (a) 2D force maps (x, y) of the interfacial water structure in the gap region. The map is obtained in a 300 mM KCl solution. The force–distance curves in the bottom of the image are obtained from the top panel. (b) 2D force maps (x, y) of the interfacial water structure in the overlap region. The force–distance curves in the bottom of the image are obtained from the top panel. (c) Statistics of d1 and d2 distances measured from several collagen–water interfaces. In the bottom panels of (a) and (b), the individual force–distance curves from the bottom panels of (a) and (b) are plotted in gray. The average force–distance curve is highlighted by a thick continuous line. The images were captured using ArrowUHF AuD cantilevers. Experimental parameters: f = 745 kHz; k = 8.3 N m−1; Q = 4.5; A0 = 170 pm; Asp = 100 pm. The negatively charged AFM tips used for the research in this article were NanoWorld Arrow-UHFAuD ultra-high frequency AFM probes.
Figure 3 from Diana M. Arvelo et al. 2024 “Interfacial water on collagen nanoribbons by 3D AFM”
Interfacial liquid water structure on collagen provided by a negatively charged tip. (a) 2D force maps (x, y) of the interfacial water structure in the gap region. The map is obtained in a 300 mM KCl solution. The force–distance curves in the bottom of the image are obtained from the top panel. (b) 2D force maps (x, y) of the interfacial water structure in the overlap region. The force–distance curves in the bottom of the image are obtained from the top panel. (c) Statistics of d1 and d2 distances measured from several collagen–water interfaces. In the bottom panels of (a) and (b), the individual force–distance curves from the bottom panels of (a) and (b) are plotted in gray. The average force–distance curve is highlighted by a thick continuous line. The images were captured using ArrowUHF AuD cantilevers. Experimental parameters: f = 745 kHz; k = 8.3 N m−1; Q = 4.5; A0 = 170 pm; Asp = 100 pm.

*Diana M. Arvelo, Clara Garcia-Sacristan, Enrique Chacón, Pedro Tarazona and Ricardo Garcia
Interfacial water on collagen nanoribbons by 3D AFM
Journal of Chemical Physics 160, 164714 (2024)
DOI: https://doi.org/10.1063/5.0205611

The article “Interfacial water on collagen nanoribbons by 3D AFM” by Diana M. Arvelo, Clara Garcia-Sacristan, Enrique Chacón, Pedro Tarazona and Ricardo Garcia is licensed under a Creative Commons Attribution 4.0 International License, which permits use, sharing, adaptation, distribution and reproduction in any medium or format, as long as you give appropriate credit to the original author(s) and the source, provide a link to the Creative Commons license, and indicate if changes were made. The images or other third-party material in this article are included in the article’s Creative Commons license, unless indicated otherwise in a credit line to the material. If material is not included in the article’s Creative Commons license and your intended use is not permitted by statutory regulation or exceeds the permitted use, you will need to obtain permission directly from the copyright holder. To view a copy of this license, visit https://creativecommons.org/licenses/by/4.0/.