Local probing of the nanoscale hydration landscape of kaolinite basal facets in the presence of ions

Kaolinite is one of the most abundant natural clay minerals within soils at the Earth’s surface and within rock units in the upper crust. *

The interface between aqueous solutions and the facets of kaolinite plays an important role in a wide range of technological applications including tribology, paper production, oil recovery, waste water treatment and medical devices. *

This is made possible by kaolinite’s layered structure, with its two basal surfaces -aluminol and siloxane-exhibiting different properties and reactivity. *

Both macroscopic and nanoscale studies point to a strong dependence of kaolinite’s surface properties on its local hydration structure. No experimental results, however, have systematically and comparatively investigated the hydration landscape of both basal facets to date. *

In the article “Local probing of the nanoscale hydration landscape of kaolinite basal facets in the presence of ions”  Clodomiro Cafolla, Tai Bui, Tran Thi Bao Le, Andrea Zen, Weparn J. Tay, Alberto Striolo, Angelos Michaelides, Hugh Christopher Greenwell and Kislon Voïtchovsky combine high-resolution atomic force microscopy (AFM) imaging and force spectroscopy with classical molecular dynamics (MD) simulations to illustrate key differences in the hydration behaviour of the aluminol and siloxane facets of kaolinite particles immersed in water and NaCl solutions. *

This combined approach allows the authors to overcome the limitations of each technique via the advantages of the other. Specifically, AFM images highlight the differences in the first hydration layer of each facet and serve as a basis for force spectroscopy measurements of the full hydration profile at a given location. *

Water densities extracted from MD help interpret the AFM results, both in the absence and in the presence of added Na+ ions. *

Complementary AFM spectroscopy measurements show an excellent agreement between the conservative component and MD’s water density profiles, with discrete hydration layers on both facets and little sensitivity to added ions. *

The dissipative component of the measured AFM tip-sample interactions is more sensitive to the presence of ions, with MD suggesting a link with the local water dynamics and transient instabilities between stable hydration layers. *

These effects are facet-dependant and more pronounced on the aluminol facet where the first water layer is better defined. Increasing the salt concentration allows hydrated ions to form more stable layers, with hints of organised ionic domains. *

The results provide unique insights into both the equilibrium molecular structure and dynamics of the kaolinite facets, potentially informing applications involving interfacial processes. *

The AFM experiments were conducted at 25 ± 0.1 °C using a commercial atomic force microscope equipped with temperature control.
NanoWorld Arrow-UHF silicon AFM probes were used.
The AFM cantilevers were thoroughly washed with pure water (20 times with 100 μl) and then with the solution of interest (40 times with 100 μl).
Experiments were performed at near neutral pH 5.8. This ensured that only the metal ions of interest were present on the AFM cantilever. Thorough cleaning procedures were implemented to avoid any possible sources of contamination. *

During the measurements, the AFM cantilever and the sample were fully immersed in the aqueous ionic solution of interest. The thermal spectrum of the AFM cantilever was used to perform the flexural calibration of the AFM cantilevers. The AFM probes were found to have a flexural spring constant in the range 1.0–4.0 N/m and a resonance frequency of ∼400–900 kHz in water. These values agree with the nominal range and the literature. The AFM cantilever oscillation was photo-thermally driven to ensure greater stability, making sure that the frequency response remained unaffected by any spurious contributions due to the noise produced by mechanical coupling with other experimental components of the system. *
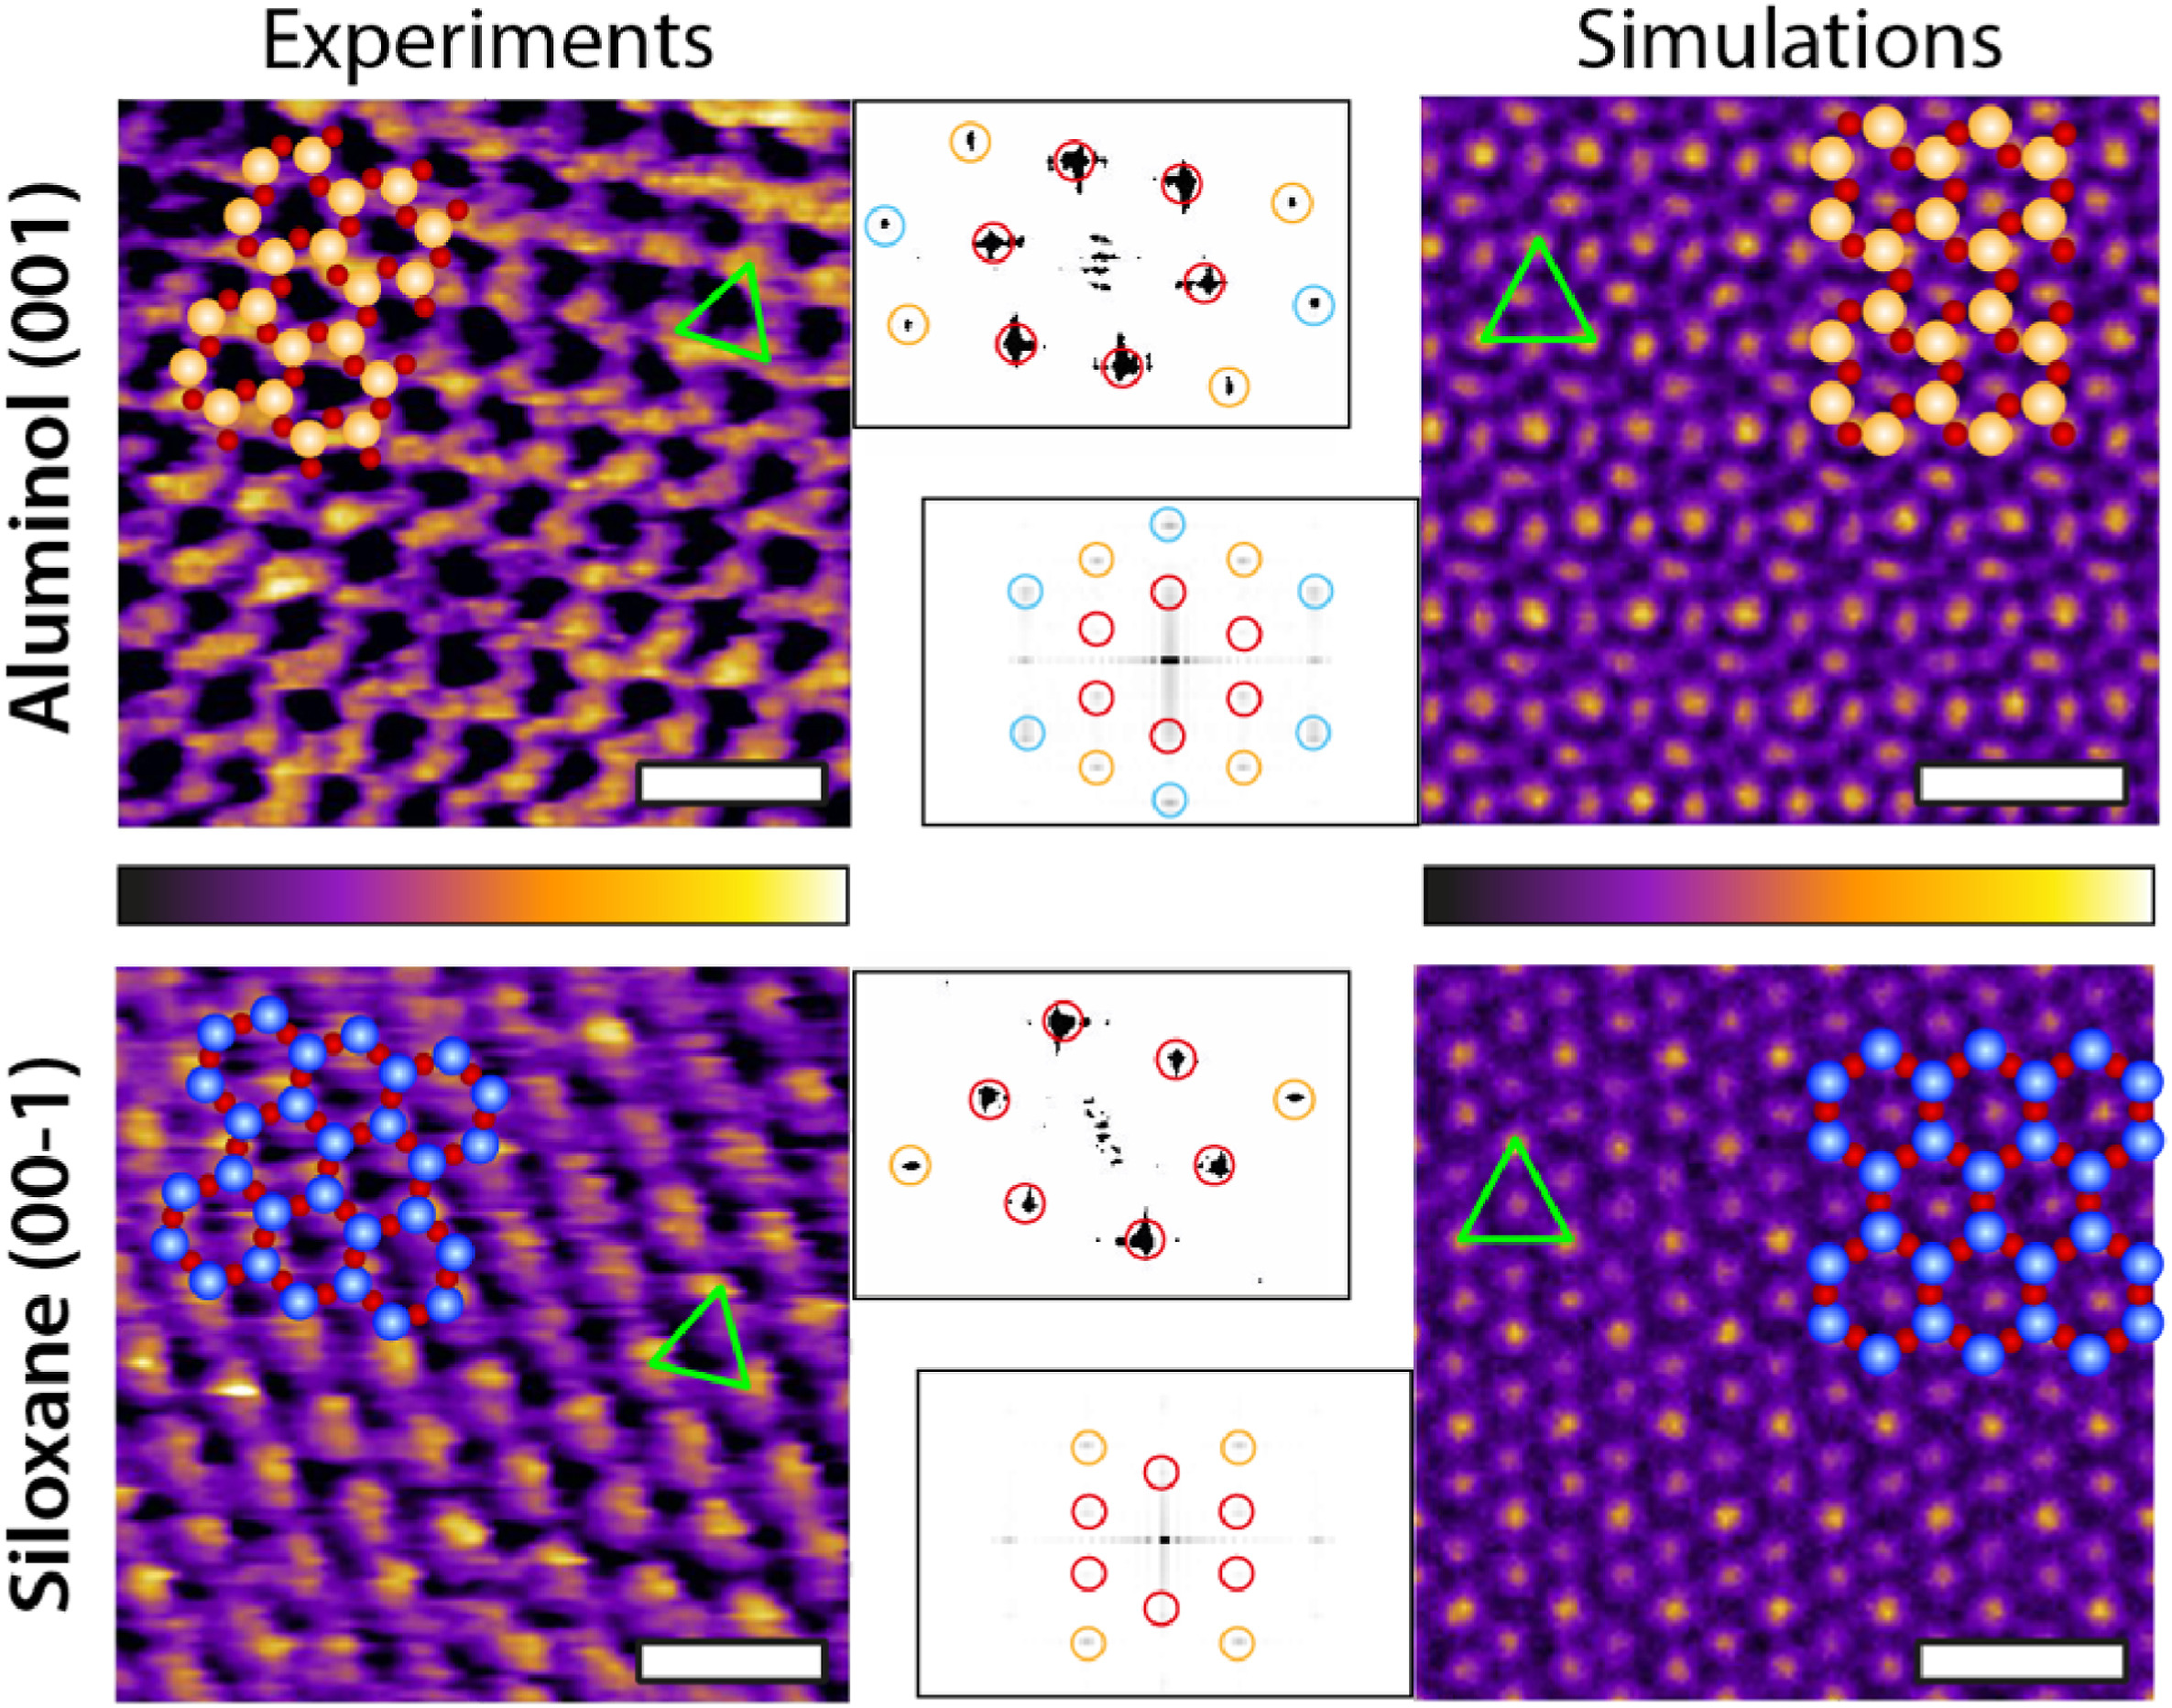
Fig. 2 from Clodomiro Cafolla et al. 2024 “Local probing of the nanoscale hydration landscape of kaolinite basal facets in the presence of ions”:Representative experimental (AFM) and computational (MD) images of both kaolinite facets. For each image, the corresponding atomic arrangement of the facet is superimposed to scale. The green triangle highlights the brightest periodic features appearing in both AFM and MD, showing a good agreement. The MD images represent the density distribution of the first hydration layer over each facet. The insets show the Fast Fourier Transform (FFT) of each image and highlight the first (red), second (orange) and third (cyan) order intensity peaks. The MD results represent a 2D projection for the water oxygen density in the first hydration layer averaged over 3 ns. The scale bar represents 1 nm. The AFM colour scale bar represents a height variation of ∼0.3 nm; the MD colour scale is based on a density range at a fixed height (first hydration layer). (For interpretation of the references to colour in this figure legend, the reader is referred to the Web version of this article.) NanoWorld Arrow-UHF silicon AFM probes were used.
Fig. 2 from Clodomiro Cafolla et al. 2024 “Local probing of the nanoscale hydration landscape of kaolinite basal facets in the presence of ions”:
Representative experimental (AFM) and computational (MD) images of both kaolinite facets. For each image, the corresponding atomic arrangement of the facet is superimposed to scale. The green triangle highlights the brightest periodic features appearing in both AFM and MD, showing a good agreement. The MD images represent the density distribution of the first hydration layer over each facet. The insets show the Fast Fourier Transform (FFT) of each image and highlight the first (red), second (orange) and third (cyan) order intensity peaks. The MD results represent a 2D projection for the water oxygen density in the first hydration layer averaged over 3 ns. The scale bar represents 1 nm. The AFM colour scale bar represents a height variation of ∼0.3 nm; the MD colour scale is based on a density range at a fixed height (first hydration layer). (For interpretation of the references to colour in this figure legend, the reader is referred to the Web version of this article.)

*Clodomiro Cafolla, Tai Bui, Tran Thi Bao Le, Andrea Zen, Weparn J. Tay, Alberto Striolo, Angelos Michaelides, Hugh Christopher Greenwell and Kislon Voïtchovsky
Local probing of the nanoscale hydration landscape of kaolinite basal facets in the presence of ions
Materials Today Physics, Volume 46, August 2024, 101504
DOI: https://doi.org/10.1016/j.mtphys.2024.101504

Open Access The article “Local probing of the nanoscale hydration landscape of kaolinite basal facets in the presence of ions” by Clodomiro Cafolla, Tai Bui, Tran Thi Bao Le, Andrea Zen, Weparn J. Tay, Alberto Striolo, Angelos Michaelides, Hugh Christopher Greenwell and Kislon Voïtchovsky is licensed under a Creative Commons Attribution 4.0 International License, which permits use, sharing, adaptation, distribution and reproduction in any medium or format, as long as you give appropriate credit to the original author(s) and the source, provide a link to the Creative Commons license, and indicate if changes were made. The images or other third party material in this article are included in the article’s Creative Commons license, unless indicated otherwise in a credit line to the material. If material is not included in the article’s Creative Commons license and your intended use is not permitted by statutory regulation or exceeds the permitted use, you will need to obtain permission directly from the copyright holder. To view a copy of this license, visit http://creativecommons.org/licenses/by/4.0/.

Cell surface fluctuations regulate early embryonic lineage sorting

In development, lineage segregation is coordinated in time and space. An important example is the mammalian inner cell mass, in which the primitive endoderm (PrE, founder of the yolk sac) physically segregates from the epiblast (EPI, founder of the fetus). While the molecular requirements have been well studied, the physical mechanisms determining spatial segregation between EPI and PrE remain elusive.*

In the article “Cell surface fluctuations regulate early embryonic lineage sorting” Ayaka Yanagida, Elena Corujo-Simon, Christopher K. Revell, Preeti Sahu, Giuliano G. Stirparo, Irene M. Aspalter, Alex K. Winkel, Ruby Peters, Henry De Belly, Davide A.D. Cassani, Sarra Achouri     Raphael Blumenfeld, Kristian Franze, Edouard Hannezo, Ewa K. Paluch, Jennifer Nichols and Kevin J. Chalut investigate the mechanical basis of EPI and PrE sorting. *

The authors find that rather than the differences in static cell surface mechanical parameters as in classical sorting models, it is the differences in surface fluctuations that robustly ensure physical lineage sorting.*

These differential surface fluctuations systematically correlate with differential cellular fluidity, which Ayaka Yanagida et al. propose together constitute a non-equilibrium sorting mechanism for EPI and PrE lineages. By combining experiments and modeling, A. Yanagida et al. identify cell surface dynamics as a key factor orchestrating the correct spatial segregation of the founder embryonic lineages.*

The surface tension of cells was measured using an Atomic Force Microscopy (AFM) based technique with a commercially available stand-alone platform for cell adhesion and cytomechanics studies mounted on an inverted confocal microscope.*

pEPI (epiblast , EPI, founder of the fetus) and pPrE (primitive endoderm, founder of the yolk sac ) tension measurements were performed using NanoWorld ARROW-TL1Au tipless silicon AFM cantilevers (nominal spring constant of 0.03 N/m).*
Sensitivity was calibrated by acquiring a force curve on a glass coverslip. Spring constant was calibrated by the thermal noise fluctuation method. Z-length parameter and setpoint force were set at 30 μm and 10 nN, respectively. Constant height mode was selected. The measurement was carried on by lowering the tipless AFM cantilever onto an empty area next to a target cell. Once the cantilever retracted (by roughly 30 μm), it was positioned above the target cell and run a compression for 200 seconds. During the constant height compression, the force acting on the AFM cantilever was recorded. After initial force relaxation, the resulting force value was used to extract surface tension.*

ES cells tension measurements were performed using the same commercial platform for cell adhesion and cytomechanics studies and a DSD2 Differential Spinning Disk both mounted on an inverted microscope.*

NanoWorld tipless silicon AFM cantilevers of the ARROW-TL1 type were chosen (nominal spring constant of 0.03 N/m). Sensitivity was calibrated by acquiring a force curve on glass. Spring constant was calibrated by the thermal noise fluctuation method. Z-length parameter and setpoint force were set at 80 μm and 4 nN, respectively. Constant height mode was selected. The measurement was carried on by lowering the tipless AFM cantilever onto an empty area next to a target cell. Once the AFM cantilever retracted (by roughly 80 μm), it was positioned above the target cell and a compression was run for 50 seconds. During the constant height compression, the force acting on the AFM cantilever was recorded. After initial force relaxation, the resulting force value was used to extract surface tension. A confocal stack was acquired using a ×40/1.1 NA water immersion objective.*

Figure 4 from Ayaka Yanagida et al. “Cell surface fluctuations regulate early embryonic lineage sorting”:Differences in ezrin-mediated surface fluctuations regulate cell sorting (A) Representative images of constitutively active Ezrin-IRES-mCherry (CA-EZR) ES cells, showing a high degree of pERM variability in the low mCherry-expressing ES cells. Surface fluctuations of single CA-EZR cells without Dox and WT H2B-BFP, and CA-EZR ES cells with or without Dox in 2i+LIF. L, M, and H indicate low, medium, and high expression of mCherry as assessed by the 3-quantiles of expression in the mCherry-expressing cells. Surface fluctuations were normalized by the mean of the Dox− surface fluctuations in each of the experiments or the mean of the WT H2B-BFP surface fluctuations. p values were calculated using one-way ANOVA, with the p values above each group representing the outcome of pairwise comparison with Dox−, and the p value above all values in CA-EZR Dox+ condition representing the comparison of all groups. (B) The surface tension of dissociated Dox-treated CA-EZR ES cells measured using the AFM technique presented in Chugh et al., 2017 is plotted against the intensity of mCherry to show that there is no correlation between CA-EZR expression and surface tension. On the right is the surface tension of dissociated WT H2B-BFP ES cells and Dox-treated CA-EZR ES cells. p value was calculated by two-way ANOVA using cell type and experimental replicate as variables. (C) θ of the homotypic doublets that can be formed from CA-EZR ES cells with or without Dox. (D) Representative images of CA-EZR ES cells and WT H2B-BFP ES cells aggregated with or without Dox. The line drawn through the center of the aggregates represents the line over which we found an intensity profile in (E). (E) Representative comparison of BFP and mCherry line scan signals in the CA-EZR and H2B-BFP ES cells aggregates with or without Dox, using the line across the images in (D). (F) Schematic showing how the radial average (dipole moment) R is calculated, along with model examples of R for distributions shown. (G) R of aggregates of CA-EZR and H2B-BFP ES cells. pEPI (epiblast , EPI, founder of the fetus) and pPrE (primitive endoderm, founder of the yolk sac ) tension measurements were performed using NanoWorld ARROW-TL1Au tipless silicon AFM cantilevers. ES cells tension measurements were performed using NanoWorld tipless silicon AFM cantilevers of the ARROW-TL1 type were chosen (nominal spring constant of 0.03 N/m).
Figure 4 from Ayaka Yanagida et al. “Cell surface fluctuations regulate early embryonic lineage sorting”:
Differences in ezrin-mediated surface fluctuations regulate cell sorting
(A) Representative images of constitutively active Ezrin-IRES-mCherry (CA-EZR) ES cells, showing a high degree of pERM variability in the low mCherry-expressing ES cells. Surface fluctuations of single CA-EZR cells without Dox and WT H2B-BFP, and CA-EZR ES cells with or without Dox in 2i+LIF. L, M, and H indicate low, medium, and high expression of mCherry as assessed by the 3-quantiles of expression in the mCherry-expressing cells. Surface fluctuations were normalized by the mean of the Dox− surface fluctuations in each of the experiments or the mean of the WT H2B-BFP surface fluctuations. p values were calculated using one-way ANOVA, with the p values above each group representing the outcome of pairwise comparison with Dox−, and the p value above all values in CA-EZR Dox+ condition representing the comparison of all groups.
(B) The surface tension of dissociated Dox-treated CA-EZR ES cells measured using the AFM technique presented in Chugh et al., 2017
is plotted against the intensity of mCherry to show that there is no correlation between CA-EZR expression and surface tension. On the right is the surface tension of dissociated WT H2B-BFP ES cells and Dox-treated CA-EZR ES cells. p value was calculated by two-way ANOVA using cell type and experimental replicate as variables.
(C) θ of the homotypic doublets that can be formed from CA-EZR ES cells with or without Dox.
(D) Representative images of CA-EZR ES cells and WT H2B-BFP ES cells aggregated with or without Dox. The line drawn through the center of the aggregates represents the line over which we found an intensity profile in (E).
(E) Representative comparison of BFP and mCherry line scan signals in the CA-EZR and H2B-BFP ES cells aggregates with or without Dox, using the line across the images in (D).
(F) Schematic showing how the radial average (dipole moment) R is calculated, along with model examples of R for distributions shown.
(G) R of aggregates of CA-EZR and H2B-BFP ES cells.

*Ayaka Yanagida, Elena Corujo-Simon, Christopher K. Revell, Preeti Sahu, Giuliano G. Stirparo, Irene M. Aspalter, Alex K. Winkel, Ruby Peters, Henry De Belly, Davide A.D. Cassani, Sarra Achouri     Raphael Blumenfeld, Kristian Franze, Edouard Hannezo, Ewa K. Paluch, Jennifer Nichols and Kevin J. Chalut
Cell surface fluctuations regulate early embryonic lineage sorting
Cell, Volume 185, Issue 5, 3 March 2022, Pages 777-793.e20
DOI: https://doi.org/10.1016/j.cell.2022.01.022

The article “Cell surface fluctuations regulate early embryonic lineage sorting” by Ayaka Yanagida, Elena Corujo-Simon, Christopher K. Revell, Preeti Sahu, Giuliano G. Stirparo, Irene M. Aspalter, Alex K. Winkel, Ruby Peters, Henry De Belly, Davide A.D. Cassani, Sarra Achouri     Raphael Blumenfeld, Kristian Franze, Edouard Hannezo, Ewa K. Paluch, Jennifer Nichols and Kevin J. Chalut is licensed under a Creative Commons Attribution 4.0 International License, which permits use, sharing, adaptation, distribution and reproduction in any medium or format, as long as you give appropriate credit to the original author(s) and the source, provide a link to the Creative Commons license, and indicate if changes were made. The images or other third-party material in this article are included in the article’s Creative Commons license, unless indicated otherwise in a credit line to the material. If material is not included in the article’s Creative Commons license and your intended use is not permitted by statutory regulation or exceeds the permitted use, you will need to obtain permission directly from the copyright holder. To view a copy of this license, visit https://creativecommons.org/licenses/by/4.0/.

Molecular and nanoscale evaluation of N-cadherin expression in invasive bladder cancer cells under control conditions or GW501516 exposure

N-cadherin is a transmembrane glycoprotein expressed by mesenchymal origin cells and is located at the adherens junctions. It regulates also cell motility and contributes to cell signaling.*

A pharmacological approach to inhibit N-cadherin expression or to block its function could be relevant to prevent disease progression and metastasis development.*

In the article “Molecular and nanoscale evaluation of N-cadherin expression in invasive bladder cancer cells under control conditions or GW501516 exposure” Céline Elie-Caille, Isabelle Lascombe, Adeline Péchery, Hugues Bittard and Sylvie Fauconnet, describe how they aimed at exploring the expression level of N-cadherin in invasive bladder cancer cells upon GW501516 exposure by both molecular biology techniques such as RTqPCR and Western blotting and atomic force microscopy (AFM) using an AFM tip functionalized with a monoclonal antibody directed against this adhesion molecule. *

The Atomic Force Microscope is a mighty nanoanalytical tool for studying biological samples under liquid, in pathological or physiological conditions, and at the scale of a single cell. It allows to characterize cells and their modification upon drug exposure or function alteration, in terms of cell surface topography or cell adhesion. *

The authors demonstrated for the first time, that the PPARβ/δ activator from a concentration of 15 µM decreased the full length N-cadherin at the mRNA and protein level and significantly reduced its cell surface coverage through the measurements of the interaction forces involving this adhesion molecule. *

Using atomic force microscopy the authors carried out a morphological and topographical analysis on bladder cancer cells of different histologic grade. *

AFM imaging was carried out in contact mode on fixed cells (with an applied force of 0.1 V), the QI mode was used for alive cell imaging, all in liquid. *

Force spectroscopy in force mapping was used for cadherin/anti-cadherin antibody measurement interactions and cadherin mapping on cells. *

NanoWorld Pyrex-Nitride PNP-TR triangular shaped silicon nitride cantilevers ( CB2 with a typical spring constant of 0.08 N/m ) were used.

For force mapping the AFM cantilevers were calibrated. The AFM probes, made of silicon nitride, were functionalized by 1% APTES (3-(Aminopropyl)triethoxysilane) in toluene during 2 h, washed extensively with toluene, and then with ethanol.
The second step consisted in an incubation in 0.2% glutaraldehyde solution during 10 min, followed by extensive washing with water. A naked AFM tip was used as a negative control.
The modified AFM tips were then incubated in 50 µg/mL primary antibody solution (N-cadherin GC-4 clone directed against the extracellular domain, N-cadherin 3B9 clone directed against the intracellular domain, E-cadherin HECD-1 clone directed against the extracellular domain) during 30 min, then washed with PBS 1X.
Finally, the functionalized AFM tip was saturated by incubation in 2 mg/mL RSA (rat serum albumin) solution during 30 min. *

Quantitative imaging AFM mode enabled to register more than hundred force spectroscopy curves per condition. The curves registered on cells were overlayed in order to highlight a specific pattern and the interaction peak areas were measured. *

Figure 1 from “Molecular and nanoscale evaluation of N-cadherin expression in invasive bladder cancer cells under control conditions or GW501516 exposure” by Céline Elie-Caille et al.:
T24 and RT4 bladder cancer cell morphology and topography. a Images from control confluent cells by phase contrast microscopy. Scale bars: 200 µm. b, c AFM images obtained on control confluent cells, after glutaraldehyde fixation, in contact mode in liquid. b AFM height images. c AFM deflection images. Scale bars: 10 µm
NanoWorld Pyrex-Nitride triangular PNP-TR silicon nitride AFM probes were used for the atomic force microscopy.
Figure 1 from “Molecular and nanoscale evaluation of N-cadherin expression in invasive bladder cancer cells under control conditions or GW501516 exposure” by Céline Elie-Caille et al.:
T24 and RT4 bladder cancer cell morphology and topography. a Images from control confluent cells by phase contrast microscopy. Scale bars: 200 µm. b, c AFM images obtained on control confluent cells, after glutaraldehyde fixation, in contact mode in liquid. b AFM height images. c AFM deflection images. Scale bars: 10 µm

* Céline Elie-Caille, Isabelle Lascombe, Adeline Péchery, Hugues Bittard amd Sylvie Fauconnet
Molecular and nanoscale evaluation of N-cadherin expression in invasive bladder cancer cells under control conditions or GW501516 exposure
Molecular and Cellular Biochemistry (2020) 471:113–127
DOI: https://doi.org/10.1007/s11010-020-03771-1

Please follow this external link to read the full article: https://link.springer.com/article/10.1007/s11010-020-03771-1

Open Access : The article “Molecular and nanoscale evaluation of N-cadherin expression in invasive bladder cancer cells under control conditions or GW501516 exposure” by Céline Elie-Caille, Isabelle Lascombe, Adeline Péchery, Hugues Bittard and Sylvie Fauconnet is licensed under a Creative Commons Attribution 4.0 International License, which permits use, sharing, adaptation, distribution and reproduction in any medium or format, as long as you give appropriate credit to the original author(s) and the source, provide a link to the Creative Commons license, and indicate if changes were made. The images or other third party material in this article are included in the article’s Creative Commons license, unless indicated otherwise in a credit line to the material. If material is not included in the article’s Creative Commons license and your intended use is not permitted by statutory regulation or exceeds the permitted use, you will need to obtain permission directly from the copyright holder. To view a copy of this license, visit https://creativecommons.org/licenses/by/4.0/.