Interfacial water on collagen nanoribbons by 3D AFM

Collagen is the most abundant structural protein in mammals. *

Type I collagen in its fibril form has a characteristic pattern structure that alternates two regions called gap and overlap. The structure and properties of collagens are highly dependent on the water and mineral content of the environment. *

In the article “Interfacial water on collagen nanoribbons by 3D AFM” Diana M. Arvelo, Clara Garcia-Sacristan, Enrique Chacón, Pedro Tarazona and Ricardo Garcia describe how they apply three dimensional atomic force microscopy (3D AFM) to characterize at angstrom-scale resolution the interfacial water structure of collagen nanoribbons.*

Three-dimensional AFM (3D AFM) is an AFM method developed for imaging at high-spatial resolution solid–liquid interfaces in the three spatial coordinates.*

This method has provided atomic-scale images of hydration and solvation layers on a variety of rigid and atomically flat surfaces, such as mica, gibbsite, boehmite, graphite, or 2D materials.*

However, imaging hydration layers on soft materials such as collagen is more challenging than on atomically flat crystalline surfaces.*

On the one hand, the force applied by the AFM tip might deform the protein. On the other hand, the height variations across gap and overlap regions might complicate the imaging of interfacial water.*

In recent years, 3D AFM has expanded its capabilities to image interfacial water on soft materials such as proteins, biopolymers, DNA, lipids, membrane proteins, and cells.*

Those experiments were performed with hydrophilic SiOx AFM tips which are negatively charged under neutral pH conditions.*

The imaging contrast mechanisms and the role of the AFM tip’s composition on the observed solvation structure are under discussion.*

More generally, both theory and experiments performed with very high salt concentrations indicated that the contrast observed in 3D AFM reflects an interplay between water particle and surface charge density distributions.*

For their article the authors apply 3D AFM to study at molecular-scale spatial resolution the structure of interfacial water on collagen nanoribbons.*

Diana M. Arvelo et al. study the influence of the AFM tip’s charge and the salt concentration on the interfacial solvent structure. They report that the interfacial structure depends on the water particle and ion charge density distributions. A non-charged AFM tip reveals the formation of hydration layers on both gap and overlap regions. A negatively charged AFM tip shows that on a gap region, the solvation structure might depart from that of the hydration layers. This effect is attributed to the adsorption of ions from the solution. Those ions occupy the voids existing between collagen molecules in the gap region. *

A home-made three-dimensional AFM was implemented on a commercially available AFM. 3D AFM was performed in the amplitude modulation mode by exciting the AFM cantilever at its first eigenmode.
At the same time when the AFM cantilever oscillates with respect to its equilibrium position, a sinusoidal signal is applied to the z-piezo to modify the relative z-distance between the sample and the AFM tip. *

Diana M. Arvelo et al. have used z-piezo displacements with amplitudes of 2.0 nm and a period (frequency) of 10 ms (100 Hz). The z-piezo signal is synchronized with the xy-displacements in such a way that for each xy-position on the surface of the material, the AFM tip performs a single and complete z-cycle. The z-data are read out every 10.24 µs and stored in 512 pixels (256 pixels per half cycle). Each xy-plane of the 3D map contains 80 × 64 pixels. Hence, the total time to acquire such a 3D-AFM image is 52 s.*

The 3D AFM experiments were performed with two types of AFM probes with different surface chemistries which have different chemical properties in aqueous solutions.*

The high-density carbon/diamond-like AFM tips grown on quartz-like AFM cantilevers that Diana M. Arvelo et al. et al used ( NanoWorld Ultra-Short Cantilevers USC-F1.2-k7.3 for high-speed AFM) remain uncharged at pH 7.4 and are called “neutral” AFM tips in the article.

The silicon AFM cantilevers with silicon AFM tips (NanoWorld Arrow-UHFAuD ultra-high frequency AFM probes) are negatively charged at neutral pH (silicon tips for short in the text) and were used to observe the formation of collagen nanoribbons.

All silicon AFM tips are readily oxidized and are usually covered by a thin native oxide layer which is hydrophilic.

The hydroxyl groups on the surface of the silicon AFM tip become negatively charged while the carbon AFM tips remain neutral (unchanged).

To image at angstrom-scale resolution, the interfacial water structure on the collagen requires reducing the lateral and vertical imaging sizes, respectively, to 5 and 1.5 nm.*

First, the authors introduce the results obtained with carbon-based tips (uncharged, NanoWorld Ultra-Short Cantilevers USC-F1.2-k7.3 for high-speed AFM). Figure 2 (of the cited article) shows some representative 2D force xz panels obtained on gap and overlap regions of a collagen nanoribbon in a concentration of 300 mM KCl. The panels are extracted from a 3D AFM image. The interlayer distances in a gap region are d1 = 0.28 nm and d2 = 0.33 nm (average values) [Fig. 2(a)], while those in an overlap region are d1 = 0.29 and d2 = 0.32 nm (average values) [Fig. 2(b)]. Those values coincide within the experimental error with the values expected for hydration layers on hydrophilic surfaces.

Next, the authors repeated the experiment using other salt concentrations. Figure 2(c) shows that the interlayers distances (within the experimental error) do not depend on the salt concentration or the collagen region. Diana M. Arvelo et al.  remark that entropic effects make the second layer more disordered than the first; therefore, d2 ≥ d1.

The structure and properties of collagens are highly dependent on the water and mineral content of the environment.

For a neutral AFM tip (USC-F1.2-k7.3), the interfacial water structure is characterized by the oscillation of the water particle density distribution with a value of 0.3 nm (hydration layers). The interfacial structure does not depend on the collagen region.

For a negatively charged AFM tip (NanoWorld Arrow-UHFAuD ultra-high frequency AFM probes) the interfacial structure might depend on the collagen region.

Hydration layers are observed in overlap regions, while in gap regions, the interfacial solvent structure is dominated by electrostatic interactions. These interactions generate interlayer distances of 0.2 nm.

The achieved results still need to be explained by the theory of 3D AFM. More detailed theoretical simulations, which are beyond the scope of the cited study, will be required to quantitatively explain the interlayer distances observed over gap regions.

However, the results presented by the authors highlight the potential of 3D AFM to identify the solvent structures on proteins and the complexity of those interfaces.*
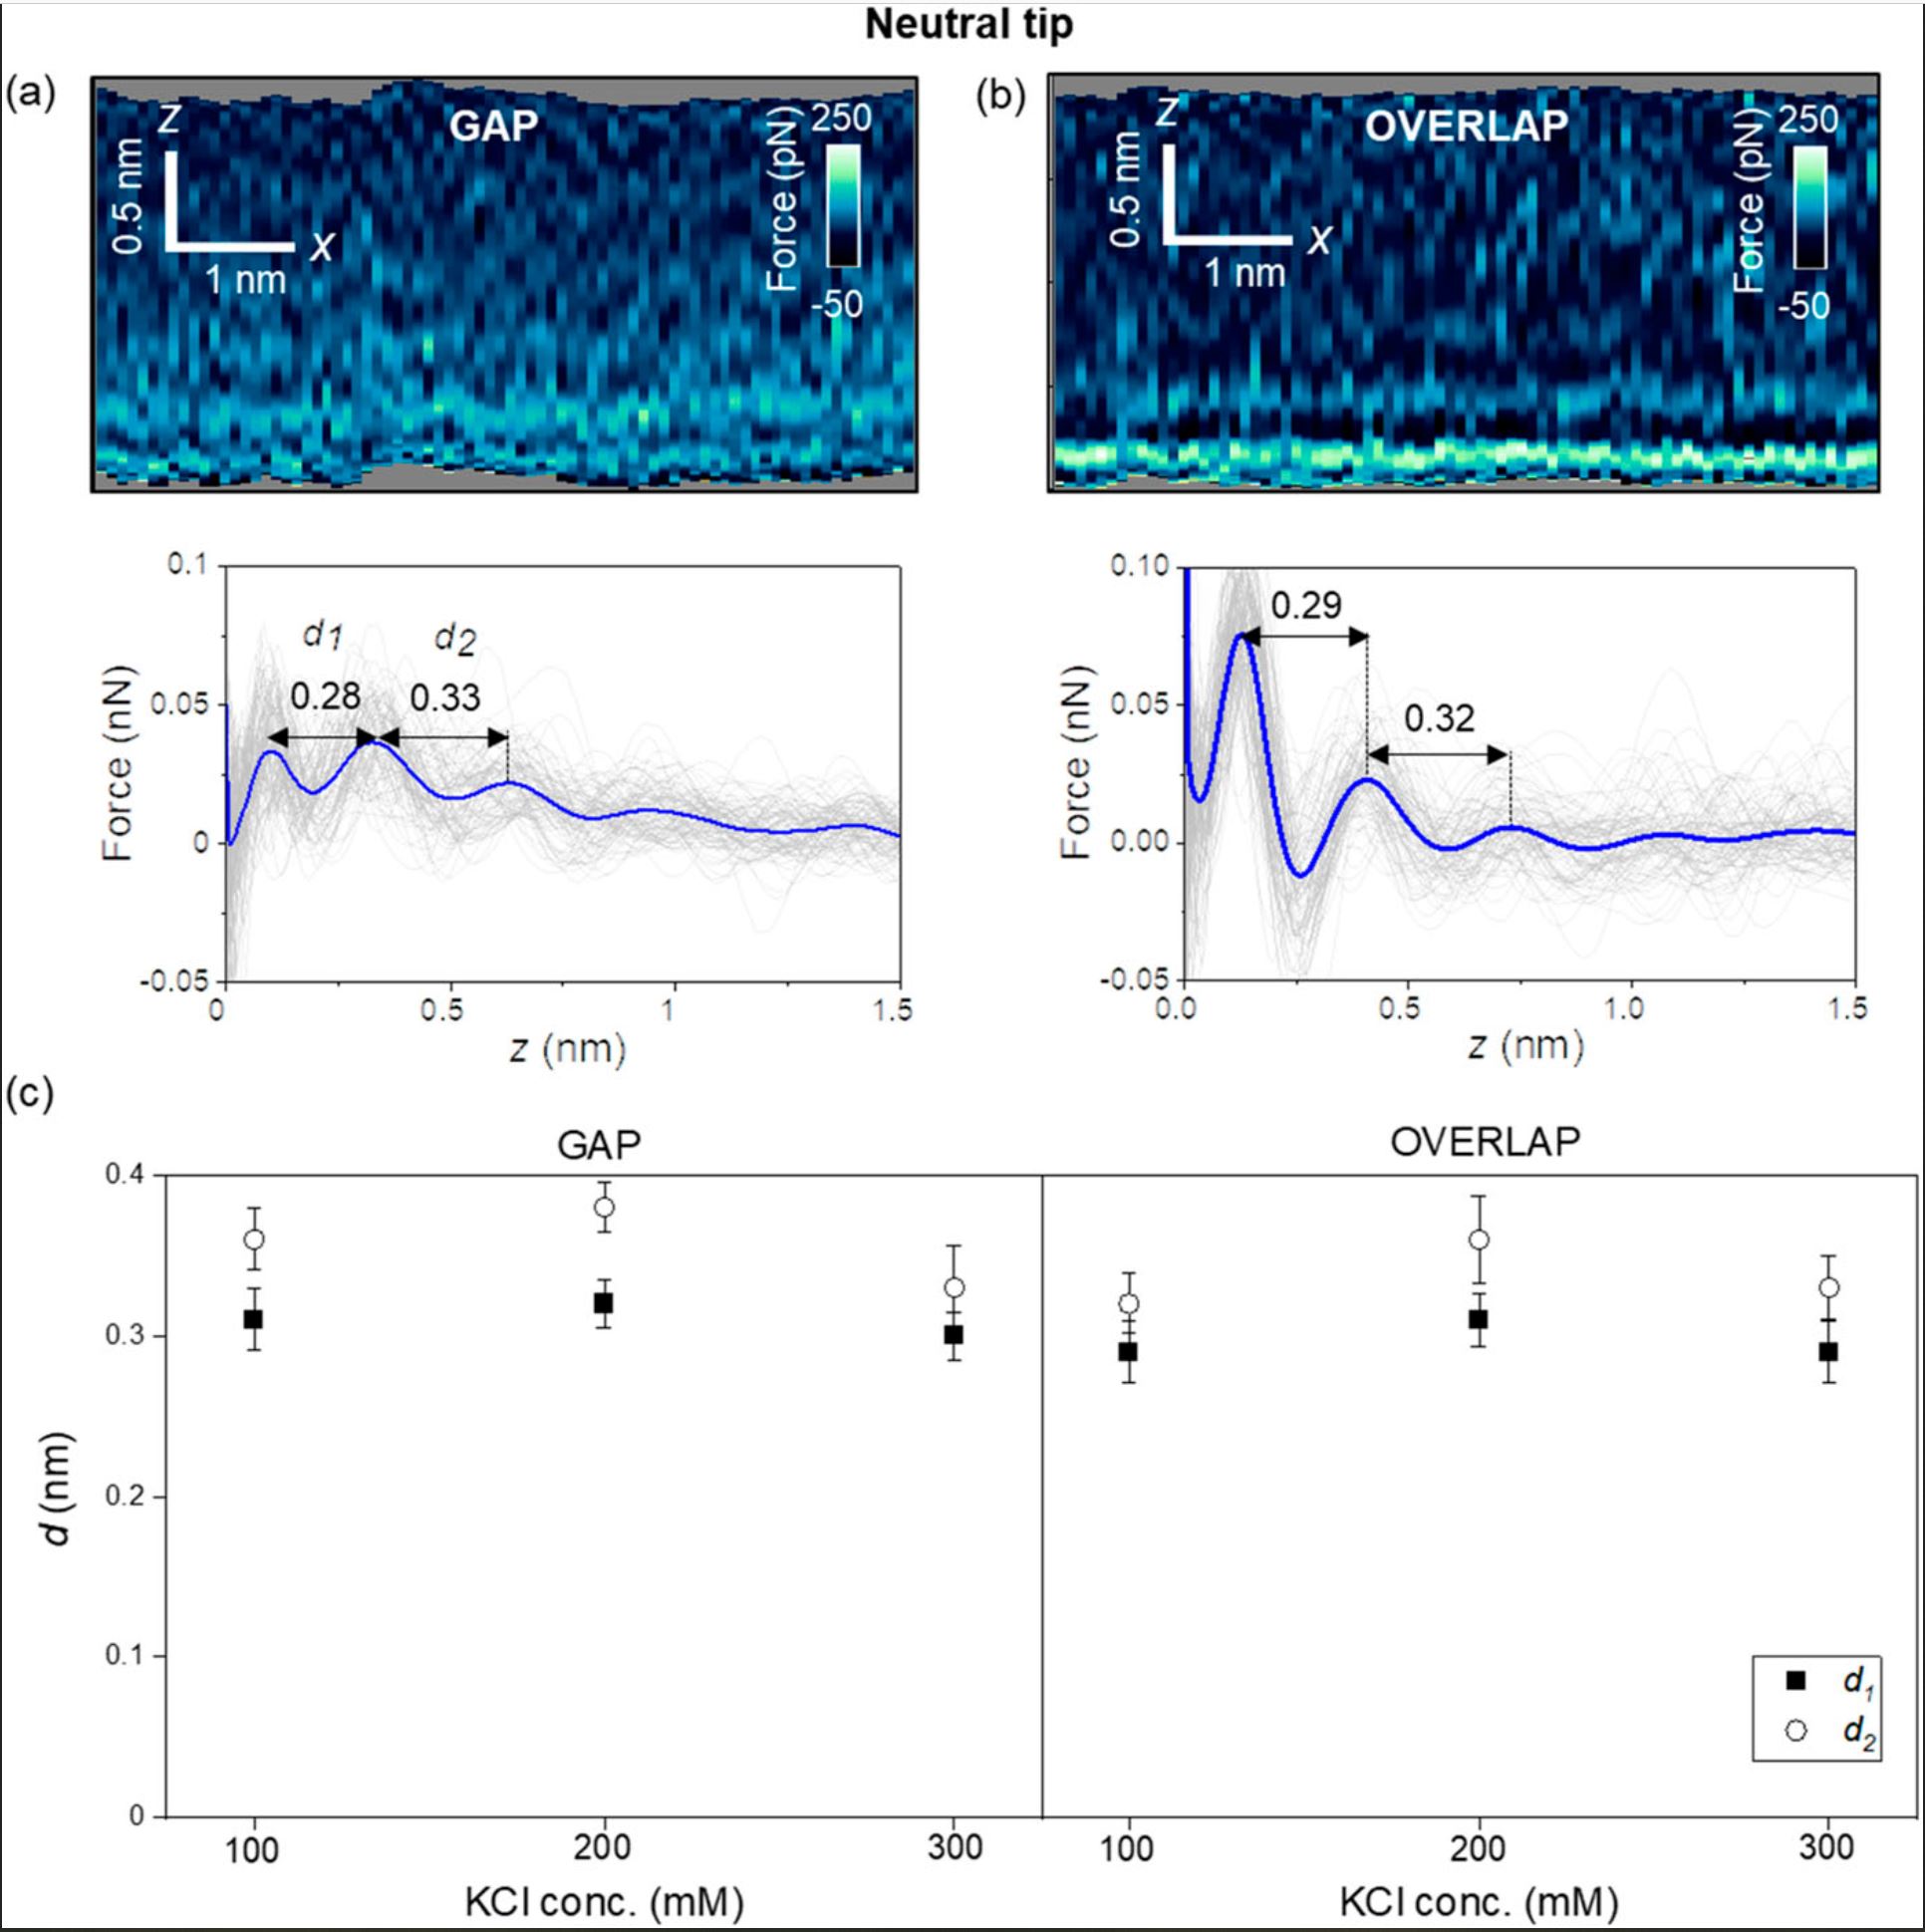
Figure 2 from Diana M. Arvelo et al. 2024 “Interfacial water on collagen nanoribbons by 3D AFM”Interfacial liquid water structure on collagen provided by an uncharged tip. (a) 2D force maps (x, y) of the interfacial water structure in the gap region. The map is obtained in a 300 mM KCl solution. The force–distance curves in the bottom of the image are obtained from the top panel. (b) 2D force maps (x, y) of the interfacial water structure in the overlap region. The force–distance curves in the bottom of the image are obtained from the top panel. (c) Statistics of d1 and d2 distances measured from several collagen–water interfaces. The individual force–distance curves from the bottom panels of (a) and (b) are plotted in gray. The average force–distance curve is highlighted by a thick continuous line. The experiments are performed with USC-F1.2-k7.3 cantilevers. Experimental parameters: f = 745 kHz; k = 6.7 N m−1; Q = 8.3; A0 = 150 pm; Asp = 100 pm. The neutral AFM tips used for the research in this article were NanoWorld Ultra-Short Cantilevers USC-F1.2-k7.3 for high-speed AFM (quartz-like AFM cantilevers with a high-density carbon AFM tip grown on them)
Figure 2 from Diana M. Arvelo et al. 2024 “Interfacial water on collagen nanoribbons by 3D AFM”
Interfacial liquid water structure on collagen provided by an uncharged tip. (a) 2D force maps (x, y) of the interfacial water structure in the gap region. The map is obtained in a 300 mM KCl solution. The force–distance curves in the bottom of the image are obtained from the top panel. (b) 2D force maps (x, y) of the interfacial water structure in the overlap region. The force–distance curves in the bottom of the image are obtained from the top panel. (c) Statistics of d1 and d2 distances measured from several collagen–water interfaces. The individual force–distance curves from the bottom panels of (a) and (b) are plotted in gray. The average force–distance curve is highlighted by a thick continuous line. The experiments are performed with USC-F1.2-k7.3 cantilevers. Experimental parameters: f = 745 kHz; k = 6.7 N m−1; Q = 8.3; A0 = 150 pm; Asp = 100 pm.
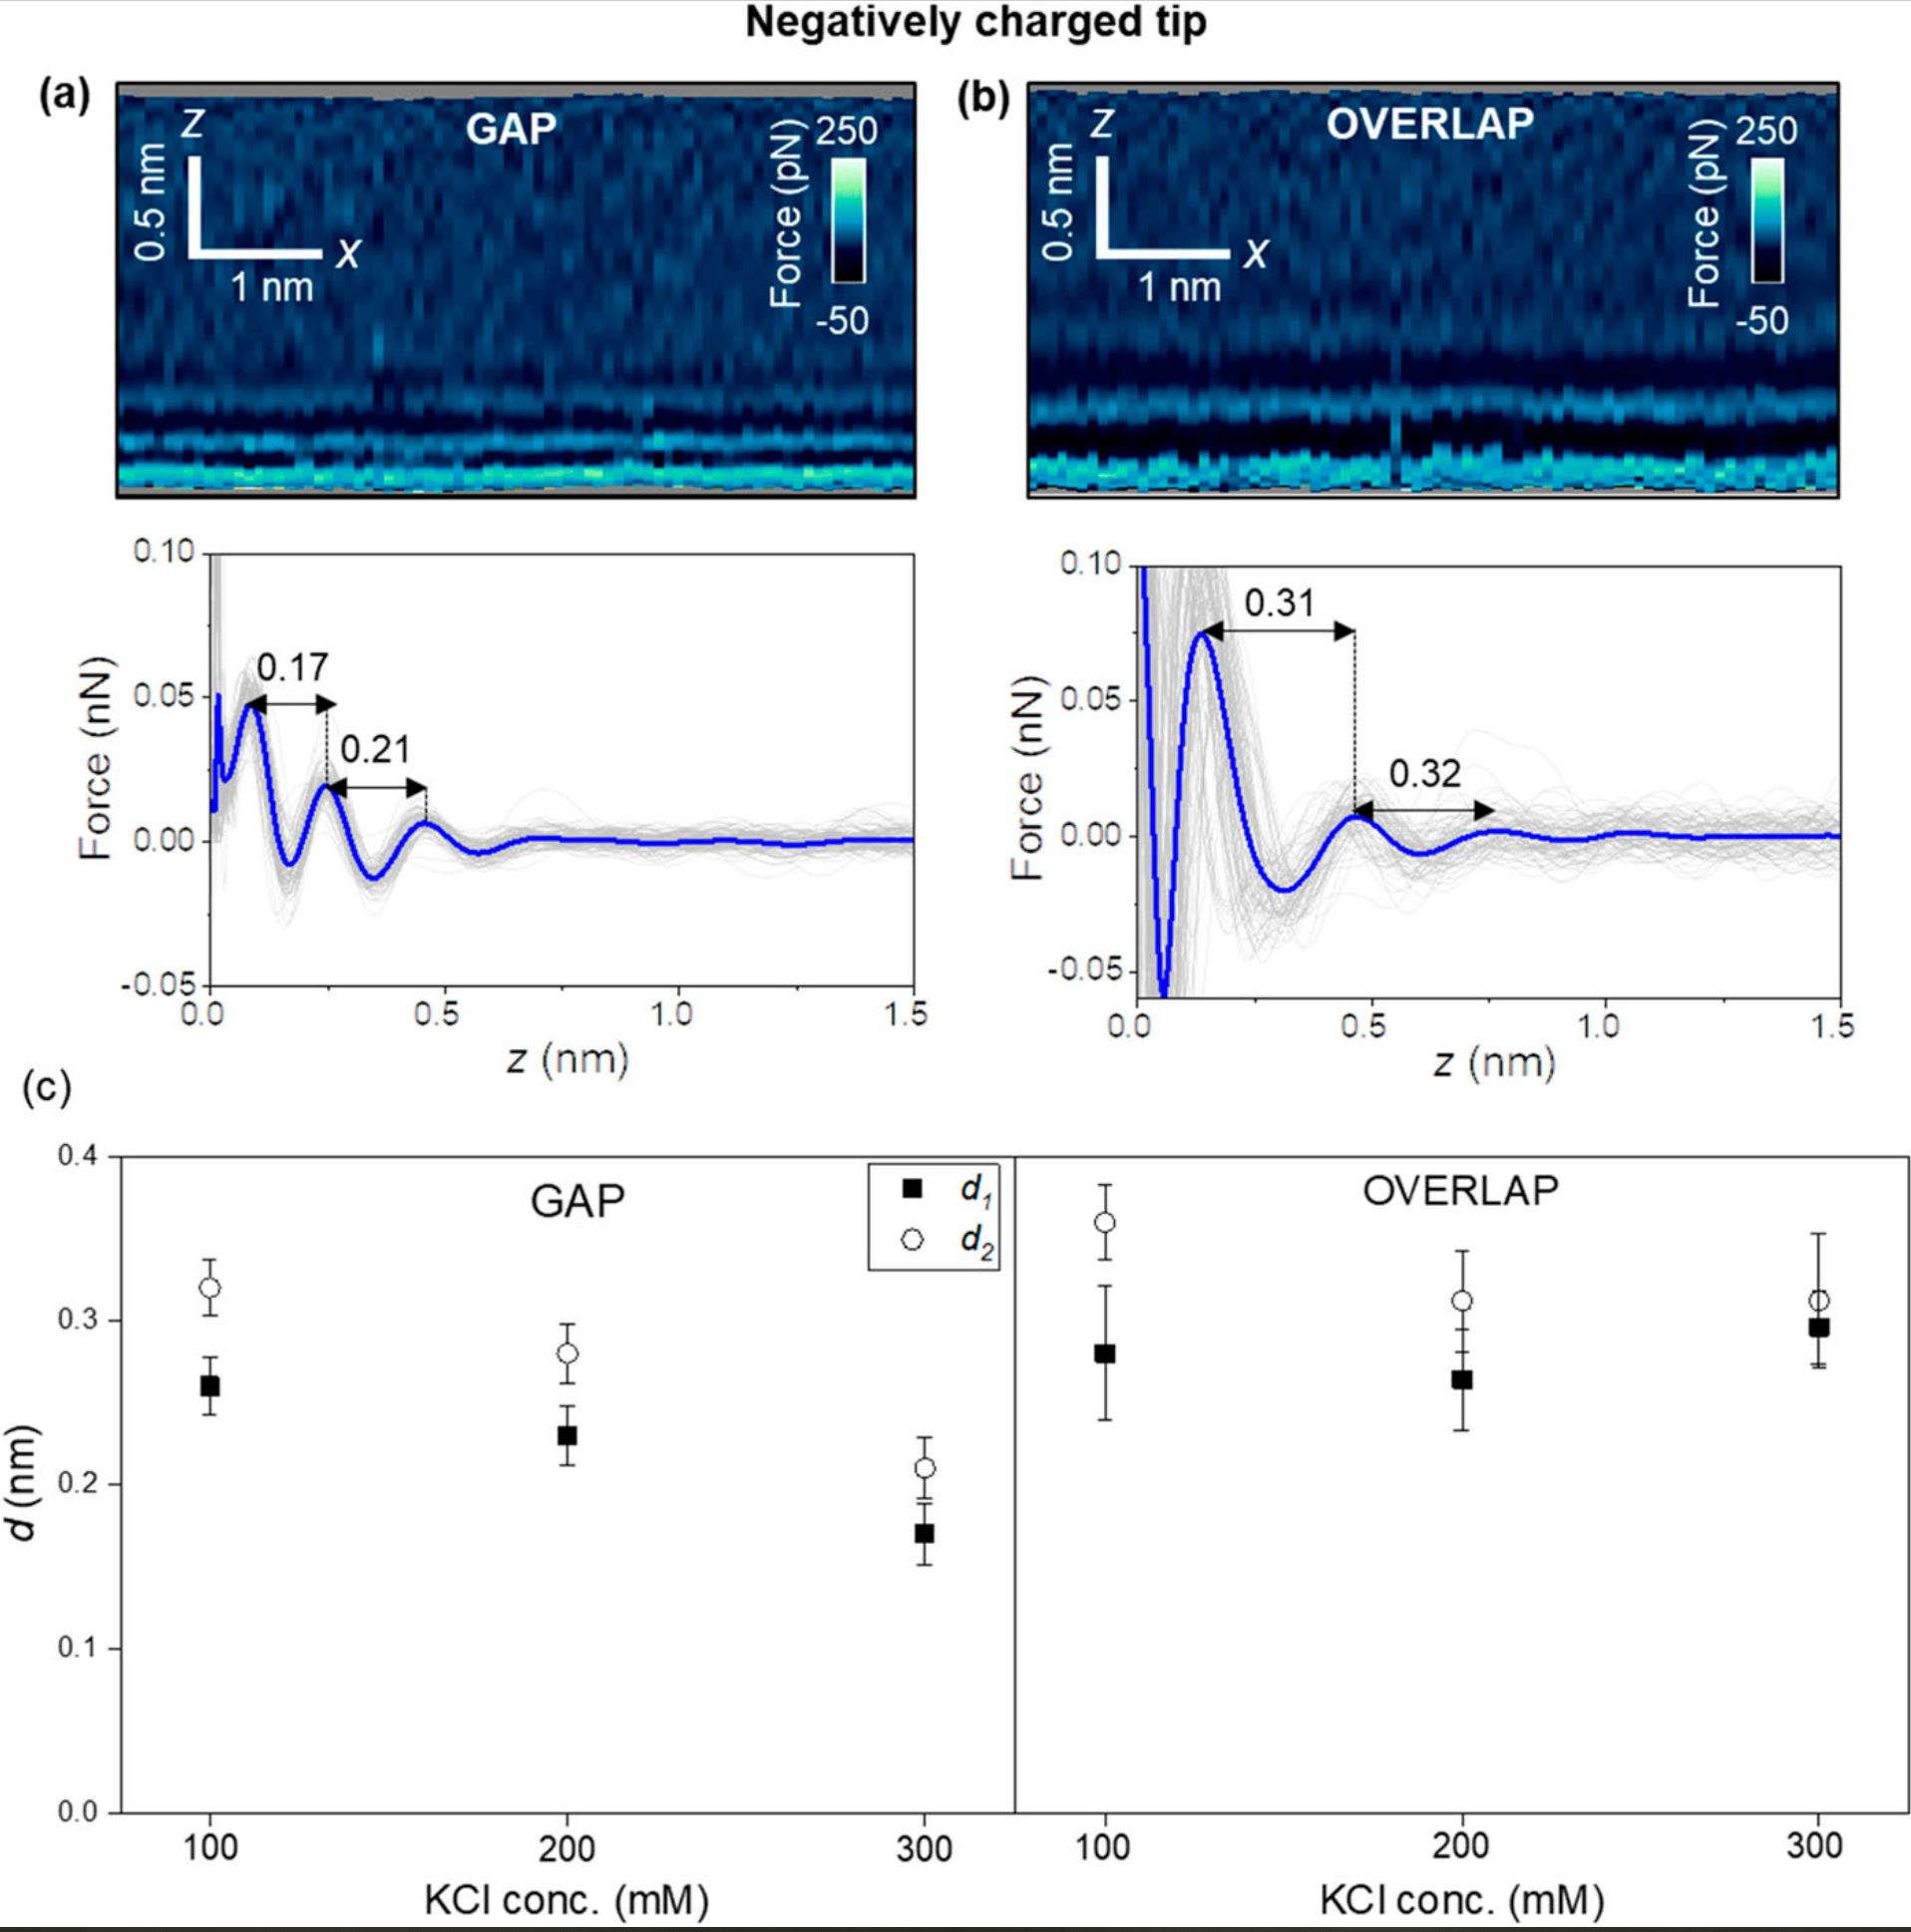


Figure 3 from Diana M. Arvelo et al. 2024 “Interfacial water on collagen nanoribbons by 3D AFM”Interfacial liquid water structure on collagen provided by a negatively charged tip. (a) 2D force maps (x, y) of the interfacial water structure in the gap region. The map is obtained in a 300 mM KCl solution. The force–distance curves in the bottom of the image are obtained from the top panel. (b) 2D force maps (x, y) of the interfacial water structure in the overlap region. The force–distance curves in the bottom of the image are obtained from the top panel. (c) Statistics of d1 and d2 distances measured from several collagen–water interfaces. In the bottom panels of (a) and (b), the individual force–distance curves from the bottom panels of (a) and (b) are plotted in gray. The average force–distance curve is highlighted by a thick continuous line. The images were captured using ArrowUHF AuD cantilevers. Experimental parameters: f = 745 kHz; k = 8.3 N m−1; Q = 4.5; A0 = 170 pm; Asp = 100 pm. The negatively charged AFM tips used for the research in this article were NanoWorld Arrow-UHFAuD ultra-high frequency AFM probes.
Figure 3 from Diana M. Arvelo et al. 2024 “Interfacial water on collagen nanoribbons by 3D AFM”
Interfacial liquid water structure on collagen provided by a negatively charged tip. (a) 2D force maps (x, y) of the interfacial water structure in the gap region. The map is obtained in a 300 mM KCl solution. The force–distance curves in the bottom of the image are obtained from the top panel. (b) 2D force maps (x, y) of the interfacial water structure in the overlap region. The force–distance curves in the bottom of the image are obtained from the top panel. (c) Statistics of d1 and d2 distances measured from several collagen–water interfaces. In the bottom panels of (a) and (b), the individual force–distance curves from the bottom panels of (a) and (b) are plotted in gray. The average force–distance curve is highlighted by a thick continuous line. The images were captured using ArrowUHF AuD cantilevers. Experimental parameters: f = 745 kHz; k = 8.3 N m−1; Q = 4.5; A0 = 170 pm; Asp = 100 pm.

*Diana M. Arvelo, Clara Garcia-Sacristan, Enrique Chacón, Pedro Tarazona and Ricardo Garcia
Interfacial water on collagen nanoribbons by 3D AFM
Journal of Chemical Physics 160, 164714 (2024)
DOI: https://doi.org/10.1063/5.0205611

The article “Interfacial water on collagen nanoribbons by 3D AFM” by Diana M. Arvelo, Clara Garcia-Sacristan, Enrique Chacón, Pedro Tarazona and Ricardo Garcia is licensed under a Creative Commons Attribution 4.0 International License, which permits use, sharing, adaptation, distribution and reproduction in any medium or format, as long as you give appropriate credit to the original author(s) and the source, provide a link to the Creative Commons license, and indicate if changes were made. The images or other third-party material in this article are included in the article’s Creative Commons license, unless indicated otherwise in a credit line to the material. If material is not included in the article’s Creative Commons license and your intended use is not permitted by statutory regulation or exceeds the permitted use, you will need to obtain permission directly from the copyright holder. To view a copy of this license, visit https://creativecommons.org/licenses/by/4.0/.

A beginner’s guide to the Characterization of Hydrogel Microarchitecture for Cellular Applications

Hydrogel materials show a number of properties which make them interesting candidates to be utilized to mimic the extracellular matrix (ECM). Therefore, these materials are attractive for use in biological applications such as tissue engineering, cell culture 3D bioprinting and more.

Are you planning to use hydrogels for the first time in your research?

Then have a look at the insightful article “A beginner’s guide to the Characterization of Hydrogel Microarchitecture for Cellular Applications” by Francisco Drusso Martinez-Garcia, Tony Fischer, Alexander Hayn, Claudia Tanja Mierke, Janette Kay Burgess and Martin Conrad Harmsen.

In their article the authors describe and evaluate the different technologies that are most commonly used to assess hydrogel microarchitecture.

Francisco Drusso Martinez-Garcia et al. explain the working principle of the various methods and also discuss the merits and limitations of each of them in view of their usefulness for the characterization of hydrogels.

They introduce and explore the pros and cons of the following methods: Scanning Electron Microscopy (SEM), Cryogenic Scanning Electron Microscopy (Cryo-SEM), Environmental Scanning Electron Microscopy (ESEM), Micro-Computed Tomography (µ-CT), Confocal Laser Scanning Microscopy (CLSM), Second Harmonic Generation and Atomic Force Microscopy (AFM).*

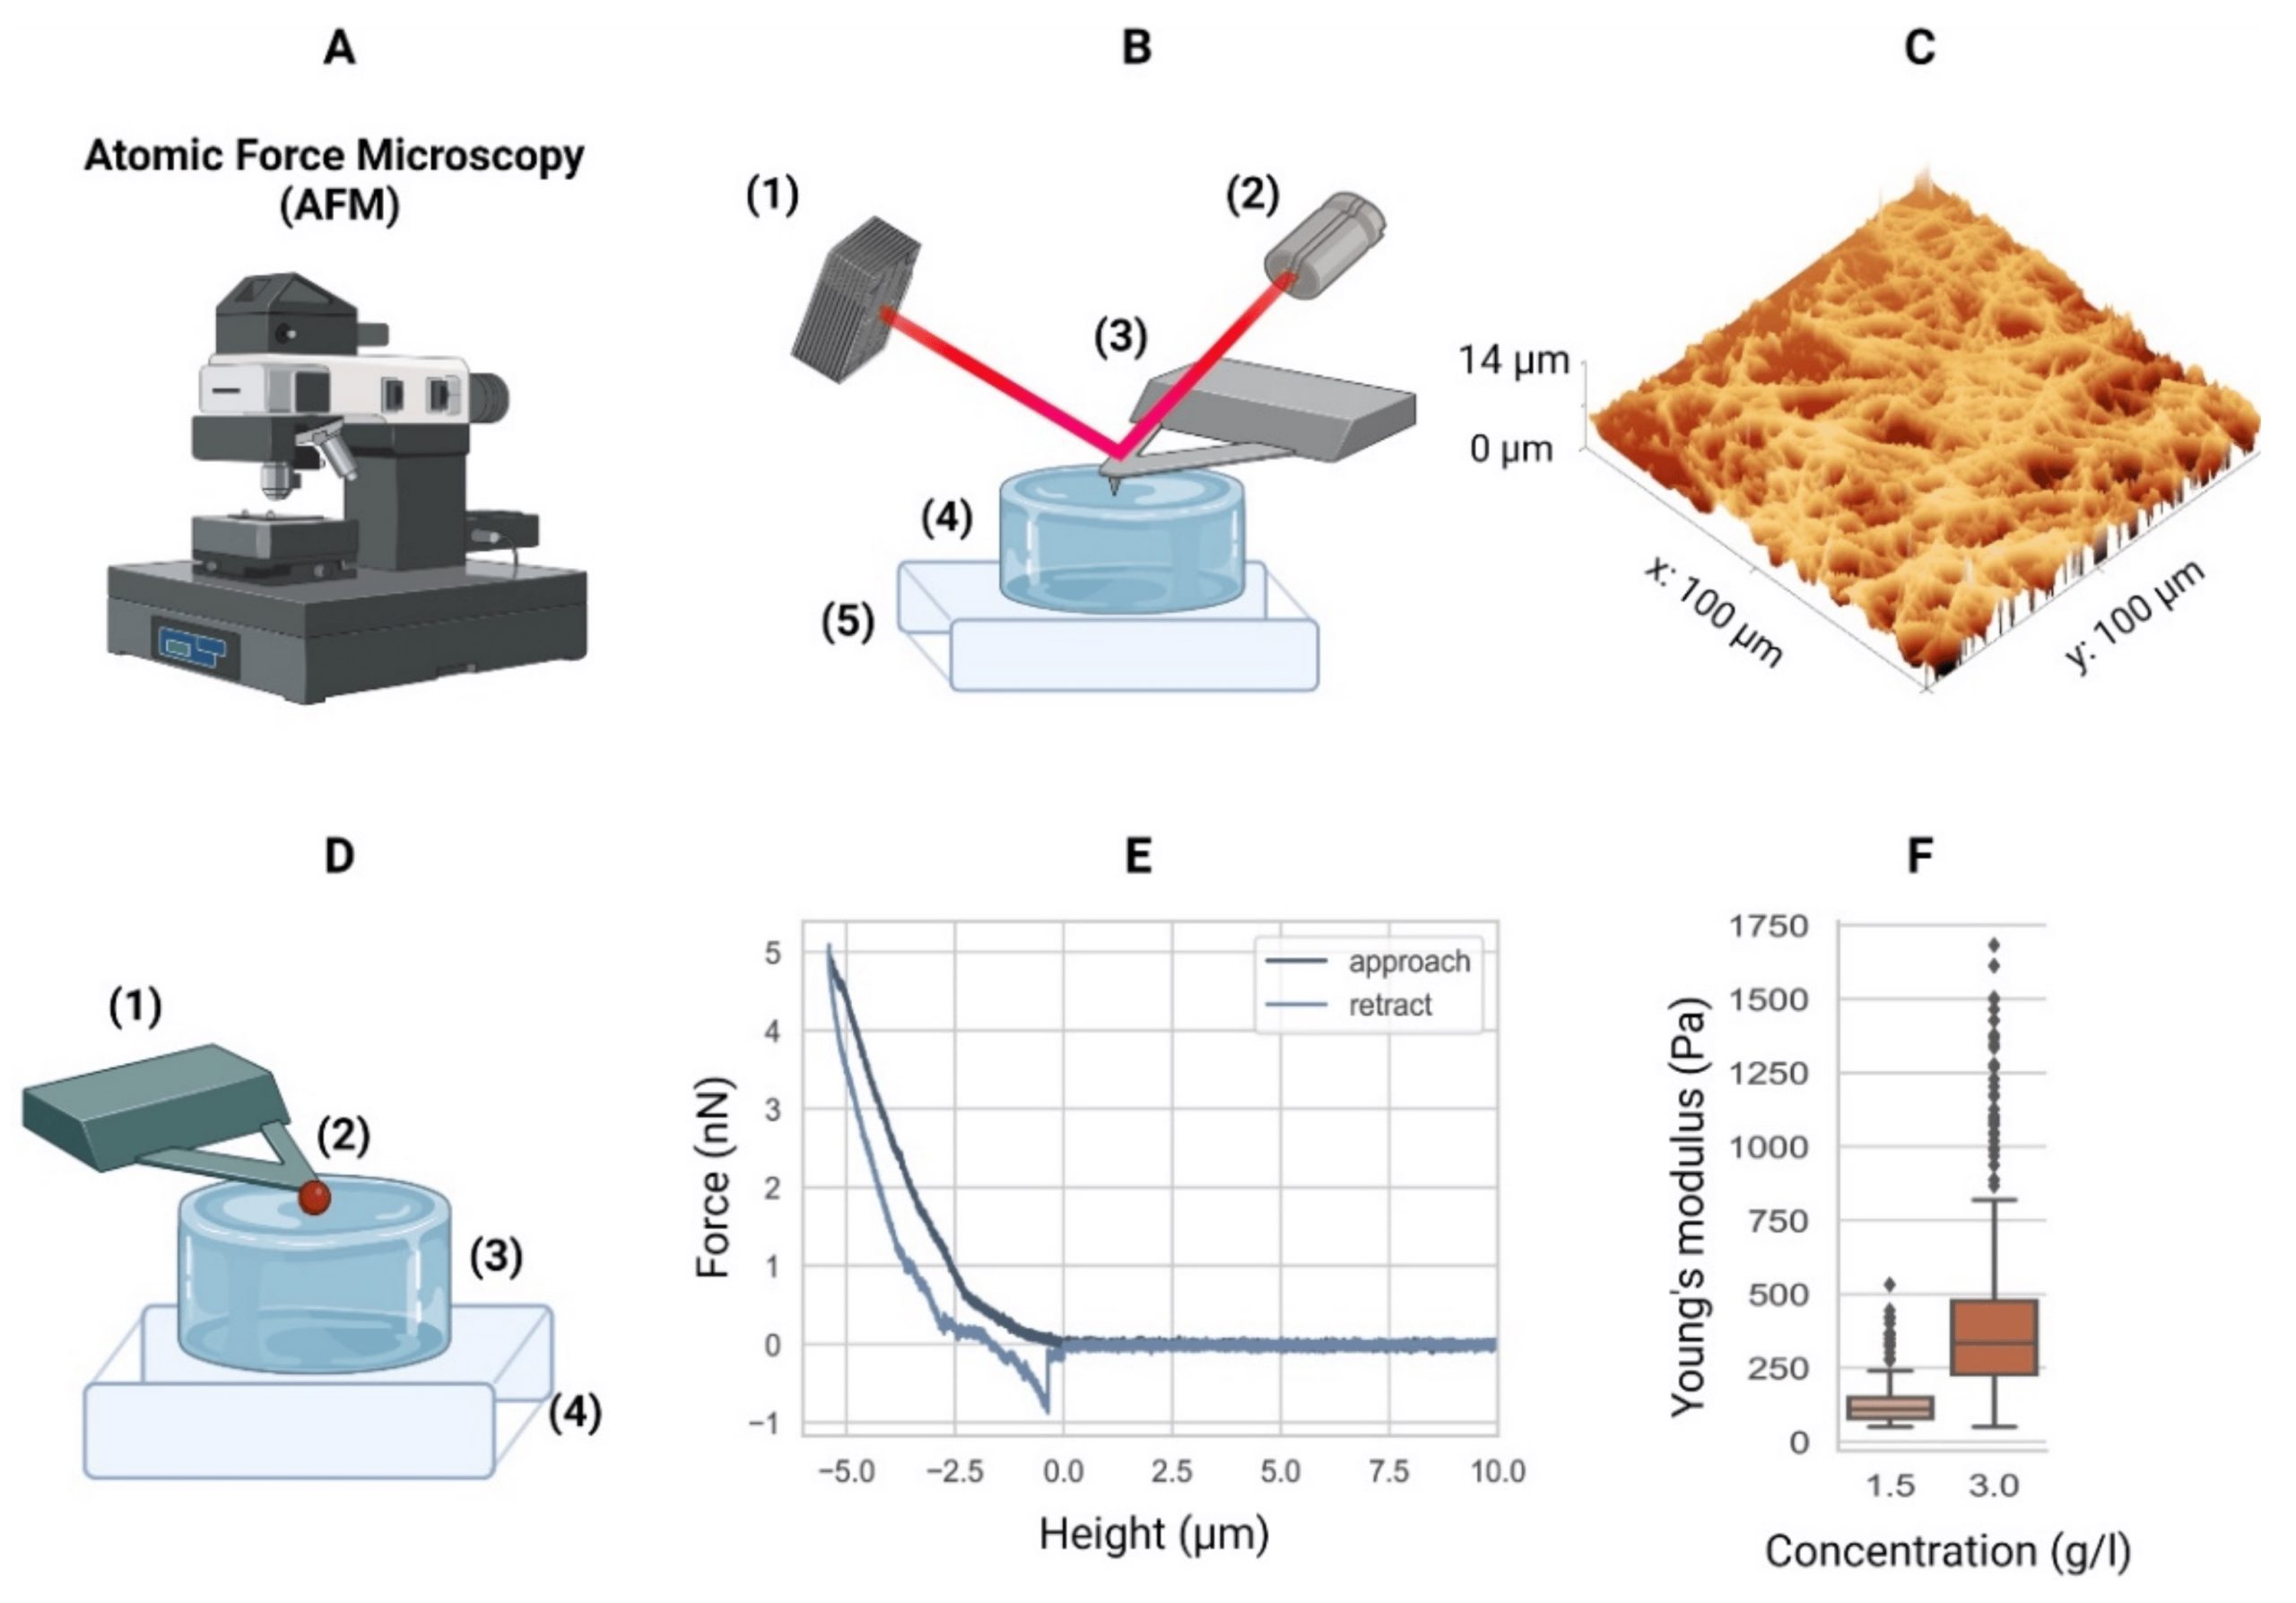
Atomic force microscopy (AFM) can be used to investigate the hydrogel surface topology as well as a hydrogel’s mechanical properties. The latter can be achieved through mathematical modelling of force-distance curves.

When using the AFM to characterize the elasticity of a hydrogel sample it is essential to take the stiffness of the investigated material into account when choosing what kind of AFM probe to use for these experiments.

If an AFM cantilever used for probing a soft sample is too stiff (if the force constant/spring constant is too high) this might result in a poor signal-to-noise ratio.

If a soft AFM probe (an AFM probe with an AFM cantilever with a low force constant) is chosen to investigate a soft material this should lead to a better signal-to-noise ratio. On the other hand, if an AFM cantilever is too soft (if the force constant is too low) then it might not be stiff enough to indent the investigated material.

Another critical factor is the shape and the size of the AFM tip.

Spheroidal AFM probes might stick to the material, resulting in artefacts, disrupted force–distance curves, or even damaged AFM cantilevers. If the AFM tip is much smaller than the pore size of the hydrogel, it might get stuck in the fibrous network microarchitecture.

On the other hand, if the spherical AFM tip, e.g. as in colloidal AFM probes (a sphere glued to end of a tipless AFM cantilever), is too large, the weight of the sphere can have a negative influence on the spring characteristics of the AFM cantilever.

All these factors and more as described in the cited article have to be carefully weighed before deciding on the settings of the atomic force microscope and choosing an AFM probe for the investigation of a specific hydrogel.

NanoWorld tipless ArrowTL2 cantilever arrays with polystyrene beads glued to them were used by the authors of this beginner’s guide to achieve the AFM data presented in the article.*

Figure 6. from Francisco Drusso Martinez-Garcia et al. 2022: Atomic force microscopy. (A) Equipment. (B) Schematic of an AFM setup with a four-quadrant photodiode (1), in which the four-quadrant photodiode (1) receives a laser (2) reflected from a cantilever (3), in this case positioned over a hydrogel (4) mounted in a piezo stage (5). For example, the height differences in a sample (4) are measured by adjusting the stage using piezo elements (5) to counter the cantilever bending on a nanometer scale. (C) The AFM can then generate a surface heightmap of the hydrogels such as a GelMA hydrogel (shown). AFM can also be used to determine the mechanical properties of hydrogels. (D) Schematic of the AFM technique to determine the elastic moduli of hydrogels with a tipless cantilever (1), spheroidal probe (2, red), hydrogel (3), and stiff substrate (4). As the cantilever represents a spring with a known spring constant, the cantilever bending due to elastic counterforces exerted by the soft material is correlated with the piezo stage height (4). (E) The so-called force–distance curves are recorded. Data from a collagen type-I hydrogel (3.0 g/L) are shown. (F) Young’s moduli of a 1.5 g/L and 3.0 g/L collagen type-I hydrogel. Outliers indicated by ◆. AFM equipment detailed in Appendix A of the cited article. NanoWorld tipless ArrowTL2 cantilever arrays with polystyrene beads glued to them were used by the authors of this beginner’s guide to achieve the AFM data presented in the article.
Figure 6. from Francisco Drusso Martinez-Garcia et al. 2022:
Atomic force microscopy. (A) Equipment. (B) Schematic of an AFM setup with a four-quadrant photodiode (1), in which the four-quadrant photodiode (1) receives a laser (2) reflected from a cantilever (3), in this case positioned over a hydrogel (4) mounted in a piezo stage (5). For example, the height differences in a sample (4) are measured by adjusting the stage using piezo elements (5) to counter the cantilever bending on a nanometer scale. (C) The AFM can then generate a surface heightmap of the hydrogels such as a GelMA hydrogel (shown). AFM can also be used to determine the mechanical properties of hydrogels. (D) Schematic of the AFM technique to determine the elastic moduli of hydrogels with a tipless cantilever (1), spheroidal probe (2, red), hydrogel (3), and stiff substrate (4). As the cantilever represents a spring with a known spring constant, the cantilever bending due to elastic counterforces exerted by the soft material is correlated with the piezo stage height (4). (E) The so-called force–distance curves are recorded. Data from a collagen type-I hydrogel (3.0 g/L) are shown. (F) Young’s moduli of a 1.5 g/L and 3.0 g/L collagen type-I hydrogel. Outliers indicated by ◆. AFM equipment detailed in Appendix A of the cited article.


NanoWorld tipless Arrow-TL2 AFM probe array with two tipless AFM cantilevers
NanoWorld® Arrow™ TL2 AFM probes are tipless AFM cantilevers for special applications. They can for example be used for attaching spheres and other objects to the free end of the AFM cantilever, or for functionalizing and sensing applications.
The Arrow™ TL2 probes are optionally available with a sample facing side gold coating (Arrow™ TL2Au).

*Francisco Drusso Martinez-Garcia, Tony Fischer, Alexander Hayn, Claudia Tanja Mierke, Janette Kay Burgess and Martin Conrad Harmsen
A Beginner’s Guide to the Characterization of Hydrogel Microarchitecture for Cellular Applications
Gels 2022, 8(9), 535
DOI: https://doi.org/10.3390/gels8090535

The article “A Beginner’s Guide to the Characterization of Hydrogel Microarchitecture for Cellular Applications” by Francisco Drusso Martinez-Garcia, Tony Fischer, Alexander Hayn, Claudia Tanja Mierke, Janette Kay Burgess and Martin Conrad Harmsen is licensed under a Creative Commons Attribution 4.0 International License, which permits use, sharing, adaptation, distribution and reproduction in any medium or format, as long as you give appropriate credit to the original author(s) and the source, provide a link to the Creative Commons license, and indicate if changes were made. The images or other third-party material in this article are included in the article’s Creative Commons license, unless indicated otherwise in a credit line to the material. If material is not included in the article’s Creative Commons license and your intended use is not permitted by statutory regulation or exceeds the permitted use, you will need to obtain permission directly from the copyright holder. To view a copy of this license, visit https://creativecommons.org/licenses/by/4.0/.

Correlation between plant cell wall stiffening and root extension arrest phenotype in combined abiotic stress of Fe and Al

The plasticity and growth of plant cell walls (CWs) is still not sufficiently understood on its molecular level. *

Atomic Force Microscopy (AFM) has been shown to be a powerful tool to measure the stiffness of plant tissues. *

In the article “Correlation between plant cell wall stiffening and root extension arrest phenotype in the combined abiotic stress of Fe and Al” Harinderbir Kaur, Jean-Marie Teulon, Christian Godon, Thierry Desnos, Shu-wen W. Chen and Jean-Luc Pellequer describe the use of atomic force microscopy (AFM) to observe elastic responses of the root transition zone of 4-day-old Arabidopsis thaliana wild-type and almt1-mutant seedlings grown under Fe or Al stresses. *

In order to evaluate the relationship between root extension and root cell wall elasticity, the authors used Atomic Force Microscopy to perform vertical indentations on surfaces of living plant roots. *

NanoWorld Pyrex-Nitride silicon-nitride PNP-TR AFM probes with triangular AFM cantilevers were used for the nanoindentation experiments with atomic force microscopy. (PNP-TR AFM cantilever beam 2 (CB2) with a typical force constant of 0.08 N/m and a typical resonant frequency of 17 kHz, typical AFM tip radius 10 nm, macroscopic half cone angles 35°). *

Force-distance (F-D) curves were measured using the Atomic Force Microscope and the PNP-TR AFM tips. *

Because of the heterogeneity of seedling CW surfaces, Harinderbir Kaur et al. used the recently developed trimechanics-3PCS framework for interpreting force-distance curves. The trimechanics-3PCS framework allows the extraction of both stiffness and elasticity along the depth of indentation and permits the investigation of the variation of stiffness with varied depth for biomaterials of heterogeneous elasticity responding to an external force. *

A glass slide with a glued seedling (see Figure 1 cited below) was positioned under the AFM cantilever with the help of an AFM optical camera. Due to the large motorized sample stage of the AFM, the glass slide was adjusted in such a way that the AFM cantilever could be positioned perpendicularly at the longitudinal middle of the glued root. The target working area, the transition zone, was 500 µm away from the root apex, almost twice the length of PNP-TR AFM cantilever. *

As shown in the article the presence of single metal species Fe2+ or Al3+ at 10 μM exerts no noticeable effect on the root growth compared with the control conditions. On the contrary, a mix of both the metal ions produced a strong root-extension arrest concomitant with significant increase of CW stiffness. *

Raising the concentration of either Fe2+or Al3+ to 20 μM, no root-extension arrest was observed; nevertheless, an increase in root stiffness occurred. In the presence of both the metal ions at 10 μM, root-extension arrest was not observed in the almt1 mutant, which substantially abolishes the ability to exude malate. The authors’ results indicate that the combination of Fe2+and Al3+ with exuded malate is crucial for both CW stiffening and root-extension arrest. *

It is shown that the elasticity of plant CW is sensitive and can be used to assess abiotic stresses on plant growth and stiffening. *

However, stiffness increase induced by single Fe2+ or Al3+ is not sufficient for arresting root growth in the described experimental conditions and unexpectedly, the stiffening and the phenotype of seedling roots such as REA are not directly correlated. *

Figure 1 from Harinderbir Kaur et al. 2024 “Correlation between plant cell wall stiffening and root extension arrest phenotype in the combined abiotic stress of Fe and Al”:Principle of nanomechanical measurement of seedling roots with atomic force microscopy. A seedling root (R) is deposited on a microscope slide using silicon glue (N, for Nusil). A fastening band of silicon is seen near the tip of the root (T). The thickness of the fastening band must be thin enough to avoid hindering the AFM support (S), but thick enough to withstand the bending of the root tip. The root is placed under the AFM cantilever (C) as observed by the AFM optical camera. The triangular shaped cantilever (200 µm long) was placed 500 µm away from the root tip in the transition zone where nanoindentation measurements proceeded (as shown). The seedling root and the AFM cantilever are placed within a liquid environment (growth solution, see Supplementary file of the cited article). AFM, atomic force microscopy. NanoWorld Pyrex-Nitride silicon-nitride PNP-TR AFM probes with triangular AFM cantilevers were used for the nanoindentation experiments with atomic force microscopy.
Figure 1 from Harinderbir Kaur et al. 2024 “Correlation between plant cell wall stiffening and root extension arrest phenotype in the combined abiotic stress of Fe and Al”:
Principle of nanomechanical measurement of seedling roots with atomic force microscopy.
A seedling root (R) is deposited on a microscope slide using silicon glue (N, for Nusil). A fastening band of silicon is seen near the tip of the root (T). The thickness of the fastening band must be thin enough to avoid hindering the AFM support (S), but thick enough to withstand the bending of the root tip. The root is placed under the AFM cantilever (C) as observed by the AFM optical camera. The triangular shaped cantilever (200 µm long) was placed 500 µm away from the root tip in the transition zone where nanoindentation measurements proceeded (as shown). The seedling root and the AFM cantilever are placed within a liquid environment (growth solution, see Supplementary file of the cited article). AFM, atomic force microscopy.

*Harinderbir Kaur, Jean‐Marie Teulon, Christian Godon, Thierry Desnos, Shu‐wen W. Chen and Jean‐Luc Pellequer
Correlation between plant cell wall stiffening and root extension arrest phenotype in the combined abiotic stress of Fe and Al
Plant, Cell & Environment 2024; 47:574–584
DOI: https://doi.org/10.1111/pce.14744

The article “Correlation between plant cell wall stiffening and root extension arrest phenotype in the combined abiotic stress of Fe and Al” by Harinderbir Kaur, Jean‐Marie Teulon, Christian Godon, Thierry Desnos, Shu‐wen W. Chen and Jean‐Luc Pellequer is licensed under a Creative Commons Attribution 4.0 International License, which permits use, sharing, adaptation, distribution and reproduction in any medium or format, as long as you give appropriate credit to the original author(s) and the source, provide a link to the Creative Commons license, and indicate if changes were made. The images or other third-party material in this article are included in the article’s Creative Commons license, unless indicated otherwise in a credit line to the material. If material is not included in the article’s Creative Commons license and your intended use is not permitted by statutory regulation or exceeds the permitted use, you will need to obtain permission directly from the copyright holder. To view a copy of this license, visit https://creativecommons.org/licenses/by/4.0/.