Atomic Force Microscopy is a powerful tool for evaluating cell mechanics.
In the recent article “Vertical Light Sheet Enhanced Side-View Imaging for AFM Cell Mechanics Studies” by Kellie Beicker, E. Timothy O’Brien III, Michael R. Falvo, Richard Superfine published in Nature Scientific Reports, the authors combine sideways imaging and a vertical light sheet illumination system integrated with AFM to achieve their results.
5 µm polystyrene beads attached to NanoWorld Arrow-TL1 tipless AFM probes were used.
Figure 5 from Beicker et. al Vertical Light Sheet Enhanced Side-View Imaging for AFM Cell Mechanics Studies: Membrane and nuclear displacements observed in response to force-rupture events between the AFM-tip and cell membrane. (a) Retraction portion of force-indentation curve with important points (A-G) identified. A, the point of zero force application to the cell, B-F, force-rupture peaks, and G, after bead releases from cell. (b) A closer examination of peaks E and F with sub-peaks of the E rupture event identified. No point is shown for E1 because this is the frame immediately following Peak E0. Inset indicates regions where displacement is measured between points E and F highlighted in green. These regions were determined through difference imaging using frames taken at E and F. (c) Regions of cell displacements determined through difference imaging highlighted in green for the sub-peaks indicated in (b). Yellow dashed lines indicate outline of AFM mounted bead. Scale bars = 5 um.
Kellie Beicker, E. Timothy O’Brien III, Michael R. Falvo, Richard Superfine
Vertical Light Sheet Enhanced Side-View Imaging for AFM Cell MechanicsStudies Nature Scientific Reports, volume 8, Article number: 1504 (2018)
DOI: https://doi.org/10.1038/s41598-018-19791-3
The article Beicker et. al, Vertical Light Sheet Enhanced Side-View Imaging for AFM Cell MechanicsStudies is licensed under a Creative Commons Attribution 4.0 International License, which permits use, sharing, adaptation, distribution and reproduction in any medium or format, as long as you give appropriate credit to the original author(s) and the source, provide a link to the Creative Commons license, and indicate if changes were made. The images or other third party material in this article are included in the article’s Creative Commons license, unless indicated otherwise in a credit line to the material. If material is not included in the article’s Creative Commons license and your intended use is not permitted by statutory regulation or exceeds the permitted use, you will need to obtain permission directly from the copyright holder. To view a copy of this license, visit http://creativecommons.org/licenses/by/4.0/.
For the AFM measurements in the article “Direct observation of the dynamics of single metal ions at the interface with solids in aqueous solutions” by Ricci, M. et al. a NanoWorld Arrow-UHFAuD AFM probe was used. Congratulations to the authors!
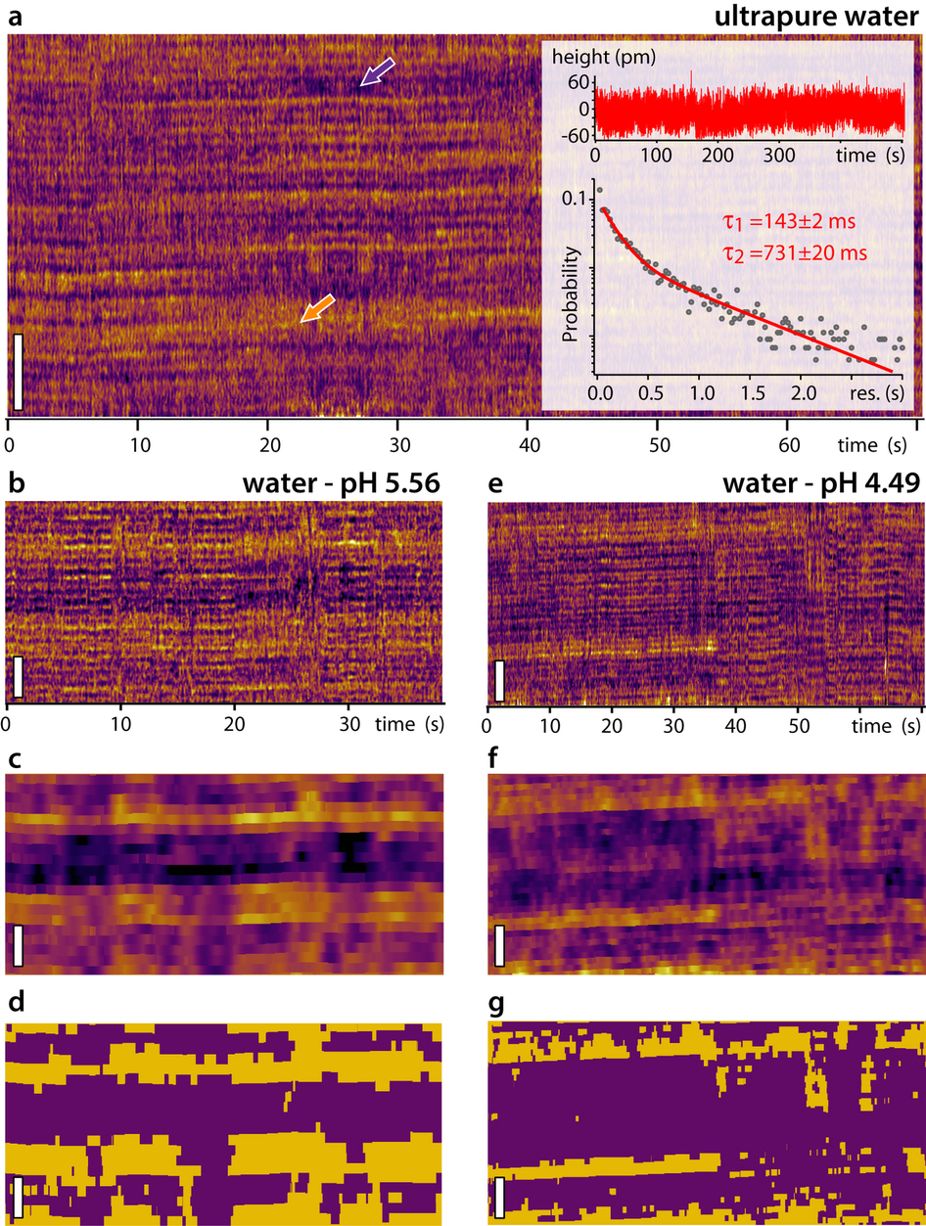
Figure 3 from: “Ricci, M. et al. Direct observation of the dynamics of single metal ions at the interface with solids in aqueous solutions.“: Kinetic experiments conducted in pure water (a) show mainly two levels (arrows) when compared to Fig. 2a. Height variations are less pronounced than in RbCl solution and analysis of the surface dynamics (inset) reveals slower timescales with a relatively strong dependence on the choice of threshold. The profile shown in the inset is taken after site averaging (see e.g. Fig. 2d), hence the small height variations. More reliable results were obtained for lower threshold values (here −20 pm, see Supplementary Fig. S10). The overall ratio between the two levels visible in (a) can be changed by adjusting the pH of the water with HCl (b–g), suggesting the higher level to be related to hydration water and the lower level to reflect adsorption of H3O+, as detected by the AFM tip. For each of the pH value studied, the raw kinetic experiments (b,e) are site-averaged (c,f) as in Fig. 2d to remove the mica corrugation and imaging noise. The height distribution of the site-averaged data is then binarised automatically (d,g) depending on whether the surface height is higher or lower than the average between the surface’s highest and lowest points. The fraction of surface interpreted as covered with H3O+ (purple in d and g) changes from 55 ± 3% to 75 ± 2%. (b,e) were acquired with a same tip. The mica samples have been rinsed with the imaging solution after being cleaved and the presence of K+ ions on the surface can be neglected (concentration <10 nM). The scale bar is 3 nm in all experiments.
Abstract:
The dynamics of ions adsorbed at the surface of immersed charged solids plays a central role in countless natural and industrial processes such as crystal growth, heterogeneous catalysis, electrochemistry, or biological function. Electrokinetic measurements typically distinguish between a so-called Stern layer of ions and water molecules directly adsorbed on to the solid’s surface, and a diffuse layer of ions further away from the surface. Dynamics within the Stern layer remain poorly understood, largely owing to a lack of in-situ atomic-level insights. Here we follow the dynamics of single Rb+ and H3O+ ions at the surface of mica in water using high-resolution atomic force microscopy with 25 ms resolution. Our results suggest that single hydrated Rb+ions reside τ1 = 104 ± 5 ms at a given location, but this is dependent on the hydration state of the surface which evolves on a slower timescale of τ2 = 610 ± 30 ms depending on H3O+ adsorption. Increasing the liquid’s temperature from 5 °C to 65 °C predictably decreases the apparent glassiness of the interfacial water, but no clear effect on the ions’ dynamics was observed, indicating a diffusion-dominated process. These timescales are remarkably slow for individual monovalent ions and could have important implications for interfacial processes in electrolytes.
Maria Ricci, William Trewby, Clodomiro Cafolla, Kislon Voïtchovsky Direct observation of the dynamics of single metal ions at the interface with solids in aqueous solutions Nature Scientific Reportsvolume 7, Article number: 43234 (2017)
doi: https://doi.org/10.1038/srep43234
Figure 1. Topography images of disordered lattice imaged at an amplitude setpoint of 2 nm. a) 10nm scan and b) 5nm scan. Both images clearly demonstrate sub-nm amorphous glass surface.
Figure 2. a) Surface topography and b) tip-sample stiffness of a region of the glass sample imaged using AMFM stiffness mapping. 10 nm scan
Using blueDrive and the NanoWorld Arrow UHF AFM tip, it was also possible to simultaneously map the topography and tip-sample stiffness using AM-FM mode (Figure 2). Like Burson et al., a disordered-appearing surface, with length scales similar to those reported in that paper could be seen. Interestingly, these structures were visible with slightly different resolutions with every attempt made. This is a testament to the low noise of the Cypher AFM and to the reliable sharpness of the Arrow UHF cantilevers.
Courtesy of Dr. Roger Proksch, Asylum Research, an Oxford Instruments Company.