Local probing of the nanoscale hydration landscape of kaolinite basal facets in the presence of ions

Kaolinite is one of the most abundant natural clay minerals within soils at the Earth’s surface and within rock units in the upper crust. *

The interface between aqueous solutions and the facets of kaolinite plays an important role in a wide range of technological applications including tribology, paper production, oil recovery, waste water treatment and medical devices. *

This is made possible by kaolinite’s layered structure, with its two basal surfaces -aluminol and siloxane-exhibiting different properties and reactivity. *

Both macroscopic and nanoscale studies point to a strong dependence of kaolinite’s surface properties on its local hydration structure. No experimental results, however, have systematically and comparatively investigated the hydration landscape of both basal facets to date. *

In the article “Local probing of the nanoscale hydration landscape of kaolinite basal facets in the presence of ions”  Clodomiro Cafolla, Tai Bui, Tran Thi Bao Le, Andrea Zen, Weparn J. Tay, Alberto Striolo, Angelos Michaelides, Hugh Christopher Greenwell and Kislon Voïtchovsky combine high-resolution atomic force microscopy (AFM) imaging and force spectroscopy with classical molecular dynamics (MD) simulations to illustrate key differences in the hydration behaviour of the aluminol and siloxane facets of kaolinite particles immersed in water and NaCl solutions. *

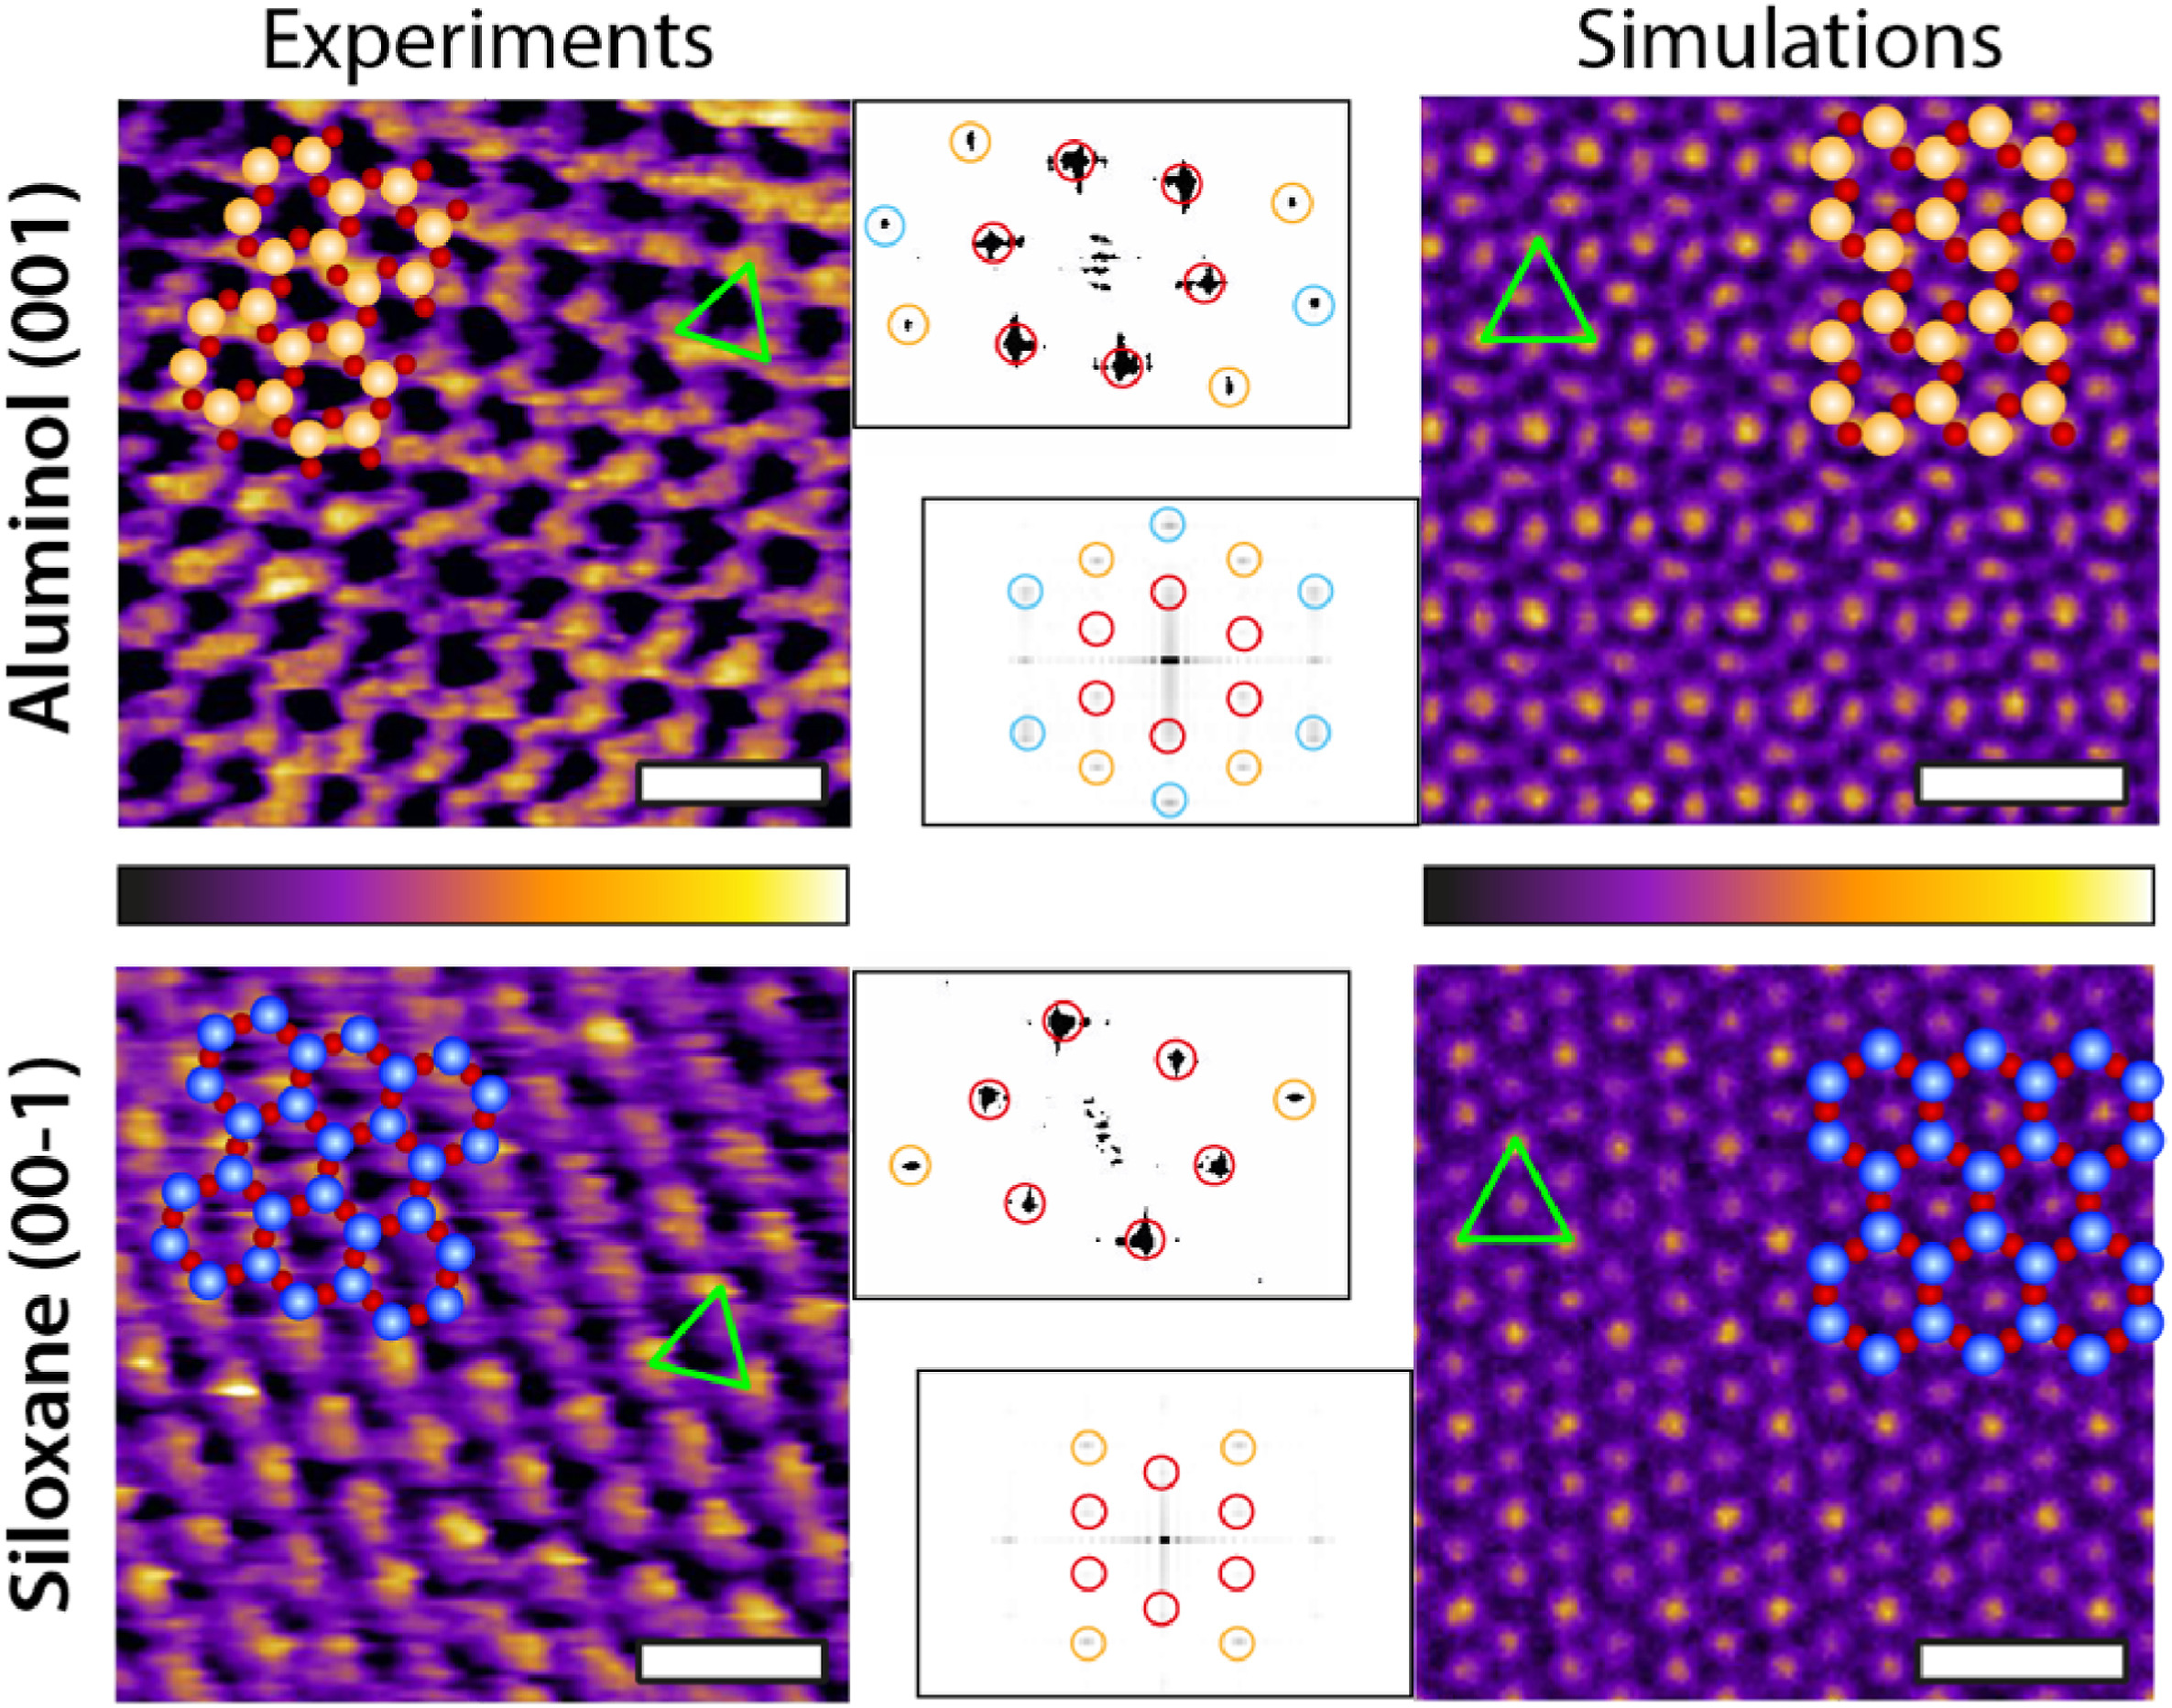
This combined approach allows the authors to overcome the limitations of each technique via the advantages of the other. Specifically, AFM images highlight the differences in the first hydration layer of each facet and serve as a basis for force spectroscopy measurements of the full hydration profile at a given location. *

Water densities extracted from MD help interpret the AFM results, both in the absence and in the presence of added Na+ ions. *

Complementary AFM spectroscopy measurements show an excellent agreement between the conservative component and MD’s water density profiles, with discrete hydration layers on both facets and little sensitivity to added ions. *

The dissipative component of the measured AFM tip-sample interactions is more sensitive to the presence of ions, with MD suggesting a link with the local water dynamics and transient instabilities between stable hydration layers. *

These effects are facet-dependant and more pronounced on the aluminol facet where the first water layer is better defined. Increasing the salt concentration allows hydrated ions to form more stable layers, with hints of organised ionic domains. *

The results provide unique insights into both the equilibrium molecular structure and dynamics of the kaolinite facets, potentially informing applications involving interfacial processes. *

The AFM experiments were conducted at 25 ± 0.1 °C using a commercial atomic force microscope equipped with temperature control.
NanoWorld Arrow-UHF silicon AFM probes were used.
The AFM cantilevers were thoroughly washed with pure water (20 times with 100 μl) and then with the solution of interest (40 times with 100 μl).
Experiments were performed at near neutral pH 5.8. This ensured that only the metal ions of interest were present on the AFM cantilever. Thorough cleaning procedures were implemented to avoid any possible sources of contamination. *

During the measurements, the AFM cantilever and the sample were fully immersed in the aqueous ionic solution of interest. The thermal spectrum of the AFM cantilever was used to perform the flexural calibration of the AFM cantilevers. The AFM probes were found to have a flexural spring constant in the range 1.0–4.0 N/m and a resonance frequency of ∼400–900 kHz in water. These values agree with the nominal range and the literature. The AFM cantilever oscillation was photo-thermally driven to ensure greater stability, making sure that the frequency response remained unaffected by any spurious contributions due to the noise produced by mechanical coupling with other experimental components of the system. *

Fig. 2 from Clodomiro Cafolla et al. 2024 “Local probing of the nanoscale hydration landscape of kaolinite basal facets in the presence of ions”:Representative experimental (AFM) and computational (MD) images of both kaolinite facets. For each image, the corresponding atomic arrangement of the facet is superimposed to scale. The green triangle highlights the brightest periodic features appearing in both AFM and MD, showing a good agreement. The MD images represent the density distribution of the first hydration layer over each facet. The insets show the Fast Fourier Transform (FFT) of each image and highlight the first (red), second (orange) and third (cyan) order intensity peaks. The MD results represent a 2D projection for the water oxygen density in the first hydration layer averaged over 3 ns. The scale bar represents 1 nm. The AFM colour scale bar represents a height variation of ∼0.3 nm; the MD colour scale is based on a density range at a fixed height (first hydration layer). (For interpretation of the references to colour in this figure legend, the reader is referred to the Web version of this article.) NanoWorld Arrow-UHF silicon AFM probes were used.
Fig. 2 from Clodomiro Cafolla et al. 2024 “Local probing of the nanoscale hydration landscape of kaolinite basal facets in the presence of ions”:
Representative experimental (AFM) and computational (MD) images of both kaolinite facets. For each image, the corresponding atomic arrangement of the facet is superimposed to scale. The green triangle highlights the brightest periodic features appearing in both AFM and MD, showing a good agreement. The MD images represent the density distribution of the first hydration layer over each facet. The insets show the Fast Fourier Transform (FFT) of each image and highlight the first (red), second (orange) and third (cyan) order intensity peaks. The MD results represent a 2D projection for the water oxygen density in the first hydration layer averaged over 3 ns. The scale bar represents 1 nm. The AFM colour scale bar represents a height variation of ∼0.3 nm; the MD colour scale is based on a density range at a fixed height (first hydration layer). (For interpretation of the references to colour in this figure legend, the reader is referred to the Web version of this article.)

*Clodomiro Cafolla, Tai Bui, Tran Thi Bao Le, Andrea Zen, Weparn J. Tay, Alberto Striolo, Angelos Michaelides, Hugh Christopher Greenwell and Kislon Voïtchovsky
Local probing of the nanoscale hydration landscape of kaolinite basal facets in the presence of ions
Materials Today Physics, Volume 46, August 2024, 101504
DOI: https://doi.org/10.1016/j.mtphys.2024.101504

Open Access The article “Local probing of the nanoscale hydration landscape of kaolinite basal facets in the presence of ions” by Clodomiro Cafolla, Tai Bui, Tran Thi Bao Le, Andrea Zen, Weparn J. Tay, Alberto Striolo, Angelos Michaelides, Hugh Christopher Greenwell and Kislon Voïtchovsky is licensed under a Creative Commons Attribution 4.0 International License, which permits use, sharing, adaptation, distribution and reproduction in any medium or format, as long as you give appropriate credit to the original author(s) and the source, provide a link to the Creative Commons license, and indicate if changes were made. The images or other third party material in this article are included in the article’s Creative Commons license, unless indicated otherwise in a credit line to the material. If material is not included in the article’s Creative Commons license and your intended use is not permitted by statutory regulation or exceeds the permitted use, you will need to obtain permission directly from the copyright holder. To view a copy of this license, visit http://creativecommons.org/licenses/by/4.0/.

Piezoelectric property of PZT nanofibers characterized by resonant piezo-force microscopy

Nano-piezoelectric materials such as 1D piezoelectric nanofibers, nanowires, and nanobelts have attracted a lot of research interest in recent years. *

Because of their active property that can transform strain energy into electricity, 1D piezoelectric nano-materials can be building blocks for nano-generators, strain sensors, acoustic sensors, force sensors, biosensors, self-powered drug delivery systems, piezoelectric transistors and other intelligent systems. *

The most important property of these active materials is their ability to convert mechanical energy into electrical energy and vice versa. *

Therefore, researchers started developing nano-sized piezoelectric materials in hope of achieving better piezoelectric properties. *

The characterization of these piezoelectric properties, especially measuring the piezoelectric strain coefficients, remains a challenge. *

The Atomic Force Microscopy (AFM)-based method to directly measure nano-materials’ piezoelectric strain coefficients is widely used.

However, several factors such as the extremely small piezoelectric deformation, the influence from the parasitic electrostatic force, and the environmental noise can make the measurement results questionable. *

In the article “Piezoelectric property of PZT nanofibers characterized by resonant piezo-force microscopy” Guitao Zhang, Xi Chen, Weihe Xu, Wei-Dong Yao, and Yong Shi address these issues by introducing a resonant piezo-force microscopy method and describing how it was used to accurately measure the piezoelectric deformation from 1D piezoelectric nanofibers. *

During the measurement the AFM tip was brought into contact with the piezoelectric sample and set to work close to the AFM tip’s first resonant frequency. *

The AFM probe used in this test was a platinum iridium coated NanoWorld Arrow-CONTPt (typical force constant 0.2 N/m, typical resonant frequency 14 KHz. The PtIr coating makes the AFM tip conductive and at the same time enhances the laser reflection from the detector facing side of the AFM cantilever to the photodetector. *

A lock-in amplifier was used to pick up the sample’s deformation signal at the testing frequency. By using this technique, the piezoelectric strain constant d33 of the Lead Zirconate Titanate (PZT) nanofiber with a diameter of 76 nm was measured. The result showed that d33 of this PZT nanofiber was around 387 pm/V. Meanwhile, by tracking the piezoelectric deformation phase image, domain structures inside PZT nanofibers were identified. *

Figure 5 from “Piezoelectric property of PZT nanofibers characterized by resonant piezo-force microscopy” by Guitao Zhang et al. : Piezoelectric deformation amplitude image from a PZT nanofiber on a silicon dioxide substrate (a) and its cross-sectional view along the horizontal direction (b). Conductive NanoWorld Arrow-CONTPt AFM probes were used for the resonant piezo-force microscopy
Figure 5 from “Piezoelectric property of PZT nanofibers characterized by resonant piezo-force microscopy” by Guitao Zhang et al. :
Piezoelectric deformation amplitude image from a PZT nanofiber on a silicon dioxide substrate (a) and its cross-sectional view along the horizontal direction (b).


Figure 6 from “Piezoelectric property of PZT nanofibers characterized by resonant piezo-force microscopy” by Guitao Zhang et al. : (a) Piezoelectric deformation phase image from a PZT nanofiber on the silicon dioxide substrate and its 3D image (b). NanoWorld Arrow-CONTPt platinum iridium 5 coated AFM probes were used.
Figure 6 from “Piezoelectric property of PZT nanofibers characterized by resonant piezo-force microscopy” by Guitao Zhang et al. :
(a) Piezoelectric deformation phase image from a PZT nanofiber on the silicon dioxide substrate and its 3D image (b).

*Guitao Zhang, Xi Chen, Weihe Xu, Wei-Dong Yao and Yong Shi
Piezoelectric property of PZT nanofibers characterized by resonant piezo-force microscopy
AIP Advances 12, 035203 (2022)
DOI: https://doi.org/10.1063/5.0081109

The article “Piezoelectric property of PZT nanofibers characterized by resonant piezo-force microscopy” by Guitao Zhang, Xi Chen, Weihe Xu, Wei-Dong Yao and Yong Shi is licensed under a Creative Commons Attribution 4.0 International License, which permits use, sharing, adaptation, distribution and reproduction in any medium or format, as long as you give appropriate credit to the original author(s) and the source, provide a link to the Creative Commons license, and indicate if changes were made. The images or other third party material in this article are included in the article’s Creative Commons license, unless indicated otherwise in a credit line to the material. If material is not included in the article’s Creative Commons license and your intended use is not permitted by statutory regulation or exceeds the permitted use, you will need to obtain permission directly from the copyright holder. To view a copy of this license, visit https://creativecommons.org/licenses/by/4.0/.

Influence of B/N co-doping on electrical and photoluminescence properties of CVD grown homoepitaxial diamond films

Boron doped diamond (BDD) has great potential in electrical, and electrochemical sensing applications. The growth parameters, substrates, and synthesis method play a vital role in the preparation of semiconducting BDD to metallic BDD. Doping of other elements along with boron (B) into diamond demonstrated improved efficacy of B doping and exceptional properties.*

In the article “Influence of B/N co-doping on electrical and photoluminescence properties of CVD grown homoepitaxial diamond films” Srinivasu Kunuku, Mateusz Ficek, Aleksandra Wieloszynska, Magdalena Tamulewicz-Szwajkowska, Krzysztof Gajewski, Miroslaw Sawczak, Aneta Lewkowicz, Jacek Ryl, Tedor Gotszalk and Robert Bogdanowicz describe how B and nitrogen (N) co-doped diamond has been synthesized on single crystalline diamond (SCD) IIa and SCD Ib substrates in a microwave plasma-assisted chemical vapor deposition process.*

The surface topography of the CVD diamond layers was investigated using atomic force microscopy (AFM), and Kelvin probe force microscopy (KPFM) was employed to measure the contact potential difference (CPD) to calculate the work function of these CVD diamond layers.*

Atomic force microscopy topography depicted the flat and smooth surface with low surface roughness for low B doping, whereas surface features like hillock structures and un-epitaxial diamond crystals with high surface roughness were observed for high B doping concentrations. KPFM measurements revealed that the work function (4.74–4.94 eV) has not varied significantly for CVD diamond synthesized with different B/C concentrations.*

NanoWorld ARROW-EFM conductive platinumirdidium5 coated AFM probes with a typical spring constant of 2.8 N/m and a typical resonant frequency of 75 kHz were used.*

Figure 2 from “Influence of B/N co-doping on electrical and photoluminescence properties of CVD grown homoepitaxial diamond films “ by Srinivasu Kunuku et al: AFM topography of B/N co-doped CVD diamond on (with fixed N/C = 0.02) SCD IIa; (a) B/C ∼ 2500 ppm (b) B/C ∼ 5000 ppm (c) B/C ∼ 7500 ppm, and KPFM CPD images of B/N co-doped CVD diamond (with fixed N/C = 0.02) on SCD IIa; (d) B/C ∼ 2500 ppm (e) B/C ∼ 5000 ppm (f) B/C ∼ 7500 ppm. NanoWorld Arrow-EFM platinumiridium coated AFM probes were used for the KPFM and surface topography measurements.
Figure 2 from “Influence of B/N co-doping on electrical and photoluminescence properties of CVD grown homoepitaxial diamond films “ by Srinivasu Kunuku et al:
AFM topography of B/N co-doped CVD diamond on (with fixed N/C = 0.02) SCD IIa; (a) B/C ∼ 2500 ppm (b) B/C ∼ 5000 ppm (c) B/C ∼ 7500 ppm, and KPFM CPD images of B/N co-doped CVD diamond (with fixed N/C = 0.02) on SCD IIa; (d) B/C ∼ 2500 ppm (e) B/C ∼ 5000 ppm (f) B/C ∼ 7500 ppm.

*Srinivasu Kunuku, Mateusz Ficek, Aleksandra Wieloszynska, Magdalena Tamulewicz-Szwajkowska, Krzysztof Gajewski, Miroslaw Sawczak, Aneta Lewkowicz, Jacek Ryl, Tedor Gotszalk and Robert Bogdanowicz
Influence of B/N co-doping on electrical and photoluminescence properties of CVD grown homoepitaxial diamond films
Nanotechnology (2022),  33 125603
DOI: https://doi.org/10.1088/1361-6528/ac4130

Please follow this external link to read the full article: https://doi.org/10.1088/1361-6528/ac4130

Open Access The article “Influence of B/N co-doping on electrical and photoluminescence properties of CVD grown homoepitaxial diamond films” by Srinivasu Kunuku, Mateusz Ficek, Aleksandra Wieloszynska, Magdalena Tamulewicz-Szwajkowska, Krzysztof Gajewski, Miroslaw Sawczak, Aneta Lewkowicz, Jacek Ryl, Tedor Gotszalk and Robert Bogdanowicz is licensed under a Creative Commons Attribution 4.0 International License, which permits use, sharing, adaptation, distribution and reproduction in any medium or format, as long as you give appropriate credit to the original author(s) and the source, provide a link to the Creative Commons license, and indicate if changes were made. The images or other third party material in this article are included in the article’s Creative Commons license, unless indicated otherwise in a credit line to the material. If material is not included in the article’s Creative Commons license and your intended use is not permitted by statutory regulation or exceeds the permitted use, you will need to obtain permission directly from the copyright holder. To view a copy of this license, visit http://creativecommons.org/licenses/by/4.0/.