Kinetic-controlled Crystallization of α-FAPbI3 Inducing Preferred Crystallographic Orientation Enhances Photovoltaic Performance

Physical properties of the polycrystalline materials are mostly determined by their microstructure. As the crystallization process can determine the microstructure, the nucleation, and growth can also control whether the materials will be resulted in single crystalline or polycrystalline. Along with the morphological changes, anisotropic properties of the materials can also be controlled. *

As a result, preferential orientation with advanced optoelectronic properties can enhance the photovoltaic devices’ performance. *

Although incorporation of additives is one of the most studied methods to stabilize the photoactive α-phase of formamidinium lead tri-iodide (α-FAPbI3), no studies focus on how the additives affect the crystallization kinetics. *

In the article “Kinetic-Controlled Crystallization of α-FAPbI3 Inducing Preferred Crystallographic Orientation Enhances Photovoltaic Performance” along with the role of methylammonium chloride (MACl) as a “stabilizer” in the formation of α-FAPbI3, Sooeun Shin, Seongrok Seo, Seonghwa Jeong, Anir S. Sharbirin, Jeongyong Kim, Hyungju Ahn, Nam-Gyu Park and Hyunjung Shin point out the additional role as a “controller” in the crystallization kinetics. *

With microscopic observations, for example, electron backscatter diffraction and selected area electron diffraction, it is examined that higher concentration of MACl induces slower crystallization kinetics, resulting in larger grain size and [100] preferred orientation. *

Optoelectronic properties of [100] preferentially oriented grains with less non-radiative recombination, a longer lifetime of charge carriers, and lower photocurrent deviations in between each grain induce higher short-circuit current density (Jsc) and fill factor. *

Resulting MACl40 mol% attains the highest power conversion efficiency (PCE) of 24.1%.

The results provide observations of a direct correlation between the crystallographic orientation and device performance as it highlights the importance of crystallization kinetics resulting in desirable microstructures for device engineering. *

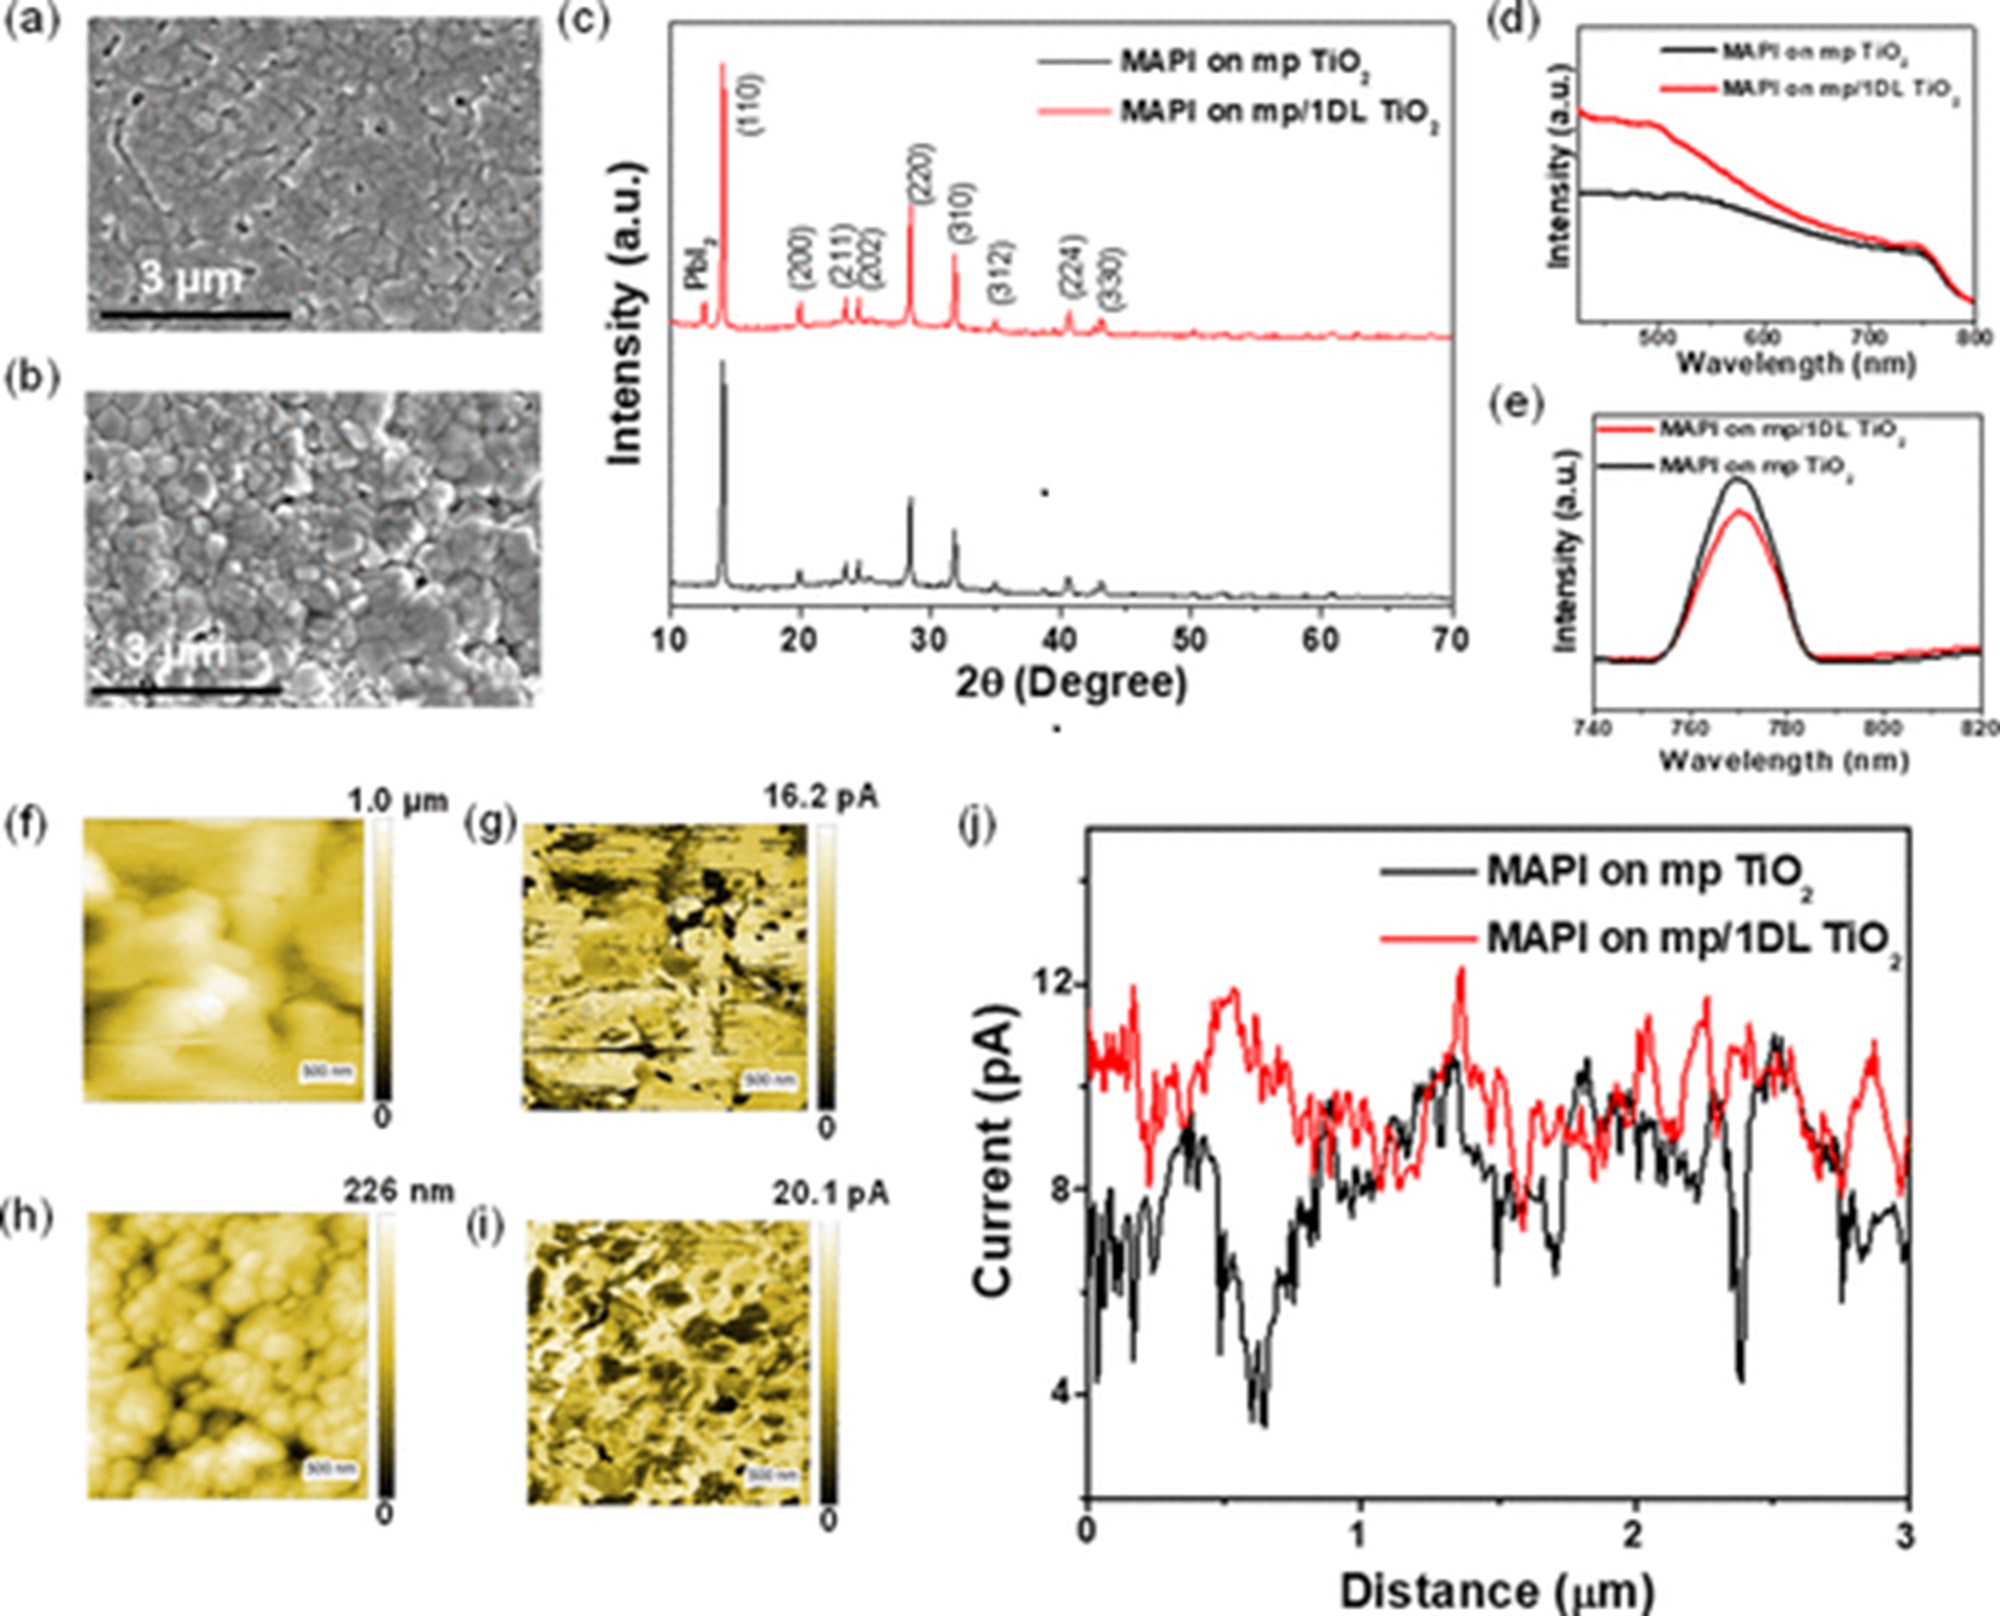
The electrical characterizations with atomic force microscopy (AFM) and conductive atomic force microscopy ( C-AFM) were done to measure the local conductance of FAPbI3 films. All measurements were performed under illumination (green LED) with a 1.3 V bias using a Pt-coated C-AFM probe (NanoWorld PlatinumIridium coated Pointprobe® CONTPt ). FTO was used for the conductive substrates. *

Conductive atomic force microscopy (C-AFM) indicated much more homogeneous photocurrent generation along the surface of (100) preferentially oriented layers. *

Figure 4 from Sooeun Shin et al. 2023 “Kinetic-Controlled Crystallization of α-FAPbI3 Inducing Preferred Crystallographic Orientation Enhances Photovoltaic Performance”:Electrical properties of (100)-oriented α-FAPbI3 thin films. a,b) Surface topography and photocurrent measurement by C-AFM of MACl10% and MACl40%. Measurements were taken under illumination (green LED) with a 1.3 V bias. Current images indicate that photocurrents were induced grain by grain, as each grain showed a distinct photocurrent. The photocurrent deviation for each grain is larger in MACl10% than in MACl40%, which shows a similar photocurrent grain by grain. c,d) Current line profile extracted from the current image (a and b). The standard deviation calculated from the magnitude of the photocurrent in each grain is displayed in the inset (0.019 and 0.014 nA for MACl10% and MACl40%, respectively). A low photocurrent was exhibited at the grain boundaries in both MACl10% and MACl40%. The dark areas measured within the current images are most likely distributed between grain edges. This may be caused by the formation of PbI2 or the loss of contact between the grain and the conducting substrate. NanoWorld PtIr5 coated Pointprobe® CONTPt AFM probes were used for the Electrical Characterization with conductive Atomic Force Microscopy (conductive-AFM, C-AFM) and for the atomic force microscopy.
Figure 4 from Sooeun Shin et al. 2023 “Kinetic-Controlled Crystallization of α-FAPbI3 Inducing Preferred Crystallographic Orientation Enhances Photovoltaic Performance”:
Electrical properties of (100)-oriented α-FAPbI3 thin films. a,b) Surface topography and photocurrent measurement by C-AFM of MACl10% and MACl40%. Measurements were taken under illumination (green LED) with a 1.3 V bias. Current images indicate that photocurrents were induced grain by grain, as each grain showed a distinct photocurrent. The photocurrent deviation for each grain is larger in MACl10% than in MACl40%, which shows a similar photocurrent grain by grain. c,d) Current line profile extracted from the current image (a and b). The standard deviation calculated from the magnitude of the photocurrent in each grain is displayed in the inset (0.019 and 0.014 nA for MACl10% and MACl40%, respectively). A low photocurrent was exhibited at the grain boundaries in both MACl10% and MACl40%. The dark areas measured within the current images are most likely distributed between grain edges. This may be caused by the formation of PbI2 or the loss of contact between the grain and the conducting substrate.

*Sooeun Shin, Seongrok Seo, Seonghwa Jeong, Anir S. Sharbirin, Jeongyong Kim, Hyungju Ahn, Nam-Gyu Park and Hyunjung Shin
Kinetic-Controlled Crystallization of α-FAPbI3 Inducing Preferred Crystallographic Orientation Enhances Photovoltaic Performance
Advanced Science, Volume 10, Issue 14, May 17, 2023, 2300798
DOI: https://doi.org/10.1002/advs.202300798

Open Access The article “Kinetic-Controlled Crystallization of α-FAPbI3 Inducing Preferred Crystallographic Orientation Enhances Photovoltaic Performance” Sooeun Shin, Seongrok Seo, Seonghwa Jeong, Anir S. Sharbirin, Jeongyong Kim, Hyungju Ahn, Nam-Gyu Park and Hyunjung Shin is licensed under a Creative Commons Attribution 4.0 International License, which permits use, sharing, adaptation, distribution and reproduction in any medium or format, as long as you give appropriate credit to the original author(s) and the source, provide a link to the Creative Commons license, and indicate if changes were made. The images or other third party material in this article are included in the article’s Creative Commons license, unless indicated otherwise in a credit line to the material. If material is not included in the article’s Creative Commons license and your intended use is not permitted by statutory regulation or exceeds the permitted use, you will need to obtain permission directly from the copyright holder. To view a copy of this license, visit http://creativecommons.org/licenses/by/4.0/.

Stiffness Mediated-Mechanosensations of Airway Smooth Muscle Cells on Linear Stiffness Gradient Hydrogels

Airflow limitation in obstructive airway disease is characterized by narrowing of the airway lumen from excessive contraction of airway smooth muscle (ASM) and remodeling of the airway wall which includes changes in the extracellular matrix (ECM) of the ASM layer.*

Previous studies on human airway smooth muscle cells ( hASMC ) have independently assessed the influence of extracellular matrix (ECM) proteins on substrates of supra-physiological stiffnesses, such as tissue culture plastic or glass.*

While the influence of discrete substrate stiffness on hASMC behavior has been examined, manipulation of both substrate stiffness and ECM proteins simultaneously (as expected in disease) has not been extensively modeled in vitro.*

In the article “Stiffness Mediated-Mechanosensation of Airway Smooth Muscle Cells on Linear Stiffness Gradient Hydrogels” Yong Hwee Tan, Kimberley C. W. Wang, Ian L. Chin, Rowan W. Sanderson, Jiayue Li, Brendan F. Kennedy, Peter B. Noble and Yu Suk Choi highlight the interplay and complexities between stiffness and ECM protein type on hASMC mechanosensation, relevant to airway remodelling in obstructive airway diseases.*

The authors first determined a physiological range of ASM layer stiffness using a porcine airway and used these empirical recordings to inform the fabrication of a linear stiffness gradient platform coated with different ECM proteins.*

Using this linear stiffness gradient platform, Yong Hwee Tan et al. profiled hASMC morphology, contractile function with alpha-smooth muscle actin (αSMA) and mechanisms of mechanosensation, specifically with nuclear translocalization of Yes-associated protein (YAP) and lamin-A expression.*

Yong Hwee Tan et al.’s assessment of hASMC mechanosensation utilized an innovative hydrogel platform delivering a linear stiffness gradient to understand stiffness-mediated cell behavior with an ECM substrate for cellular adhesion. *

The employment of a stiffness gradient that was designed after empirical measurements performed on ex vivo ASM tissue, enabled the presentation of physiologically relevant stiffnesses to study hASMC behavior.*

Using this platform, the authors of the article found that hASMC mechanosense underlying mechanical cues more than the types of proteins they are anchored to by screening hASMC morphology, contractile phenotype, and mechanomarker expression, with a few exceptions.*

While the authors acknowledge that the findings from their study were done using cells from only one donor they still think that their study provides a proof of concept for the relevance of hASMC mechanosensation to ECM stiffness, and is another step in the right direction for understanding the pathophysiological impact of airway remodeling in obstructive diseases and exploring potential avenues for improving therapy through greater fidelity of in vitro platforms that include key concepts of mechanosensation. *

Yong Hwee Tan et al. wanted to use the same method which is used to assess hydrogel stiffness, namely atomic force microscopy (AFM), to measure ASM stiffness.*

However, nanoscale measurements of ASM strips by AFM proved to be difficult due to an uneven tissue surface after de-epithelialization (Figure S1C, Supporting Information of the cited article), resulting in false force triggering.

To validate the translation of stiffness values measured from macroscale compression (ASM strips) to nanoscale indentation (AFM on hydrogels), Yong Hwee Tan et al. fabricated additional hydrogels of four different stiffnesses using well-characterized polyacrylamide and compared the stiffness of hydrogels measured by uniaxial compression tester and atomic force microscopy (Figure S2A, Supporting Information of the cited article).

The nanoscale stiffness of hydrogels was assessed using an atomic force microscope (AFM) with NanoWorld triangular Pyrex-Nitride PNP-TR AFM probes (the longer AFM cantilever beam – CB 2 – with 200 µm length was used).

These AFM tips probed hydrogels immersed in 1 × PBS with 2 nN, an approach velocity of 2 µm s−1 and a retraction velocity of 10 µm s−1.

Young’s modulus was determined from linear portions of contact-generated force curves using a custom-written code in Igor Pro.

All probe indentations were made in triplicate and averaged for a stiffness measurement in kilopascals (kPa).

An example force curve is shown in Figure S2B, Supporting Information of the cited article. Validation of a linear stiffness gradient was achieved with eight indentations on the hydrogel, 2 mm away from both edges of the hydrogel and at 1 mm intervals along the stiffness gradient axis. Measurements were plotted against displacement from the hydrogel edge (soft to stiff) (Figure 2B of the cited article).

Figure 2 from Yong Hwee Tan et al. 2024 “Stiffness Mediated-Mechanosensation of Airway Smooth Muscle Cells on Linear Stiffness Gradient Hydrogels”:Linear stiffness gradient hydrogel fabrication. A) A schematic of a two-step polymerization process. i) 120 µL of mixed polyacrylamide (PA) solution (% acrylamide + % bis-acrylamide) was added to the primary mold and left to polymerize under ii) a methacrylated coverslip for 20 min. iii) Wedge-shaped 1° gel was removed and flipped for placement of a iv) secondary mold before v) addition of a second 120 µL PA solution and polymerized under a vi) dichlorodimethylsilane-coated coverslip for 20 min. vii) Removal of coverslip and mold completes the fabrication of bi-layered stiffness gradient hydrogel. viii) the dotted arrow indicating the direction of gradient and atomic force microscopy (AFM) measurement. B) Young's moduli gradient measured by AFM. Twelve hydrogels were selected (one gel per batch) and assessed for stiffness, yielding a gradient of 4.0 kPa mm−1, with a range of 1.7 ± 1.2 to 29.6 ± 4.3 kPa (R2 = 0.998, n = 8). Data are presented as mean ± SD. NanoWorld triangular Pyrex-Nitride PNP-TR AFM probes were used to assess the stiffness of the hydrogels with atomic force microscopy.
Figure 2 from Yong Hwee Tan et al. 2024 “Stiffness Mediated-Mechanosensation of Airway Smooth Muscle Cells on Linear Stiffness Gradient Hydrogels”:
Linear stiffness gradient hydrogel fabrication. A) A schematic of a two-step polymerization process. i) 120 µL of mixed polyacrylamide (PA) solution (% acrylamide + % bis-acrylamide) was added to the primary mold and left to polymerize under ii) a methacrylated coverslip for 20 min. iii) Wedge-shaped 1° gel was removed and flipped for placement of a iv) secondary mold before v) addition of a second 120 µL PA solution and polymerized under a vi) dichlorodimethylsilane-coated coverslip for 20 min. vii) Removal of coverslip and mold completes the fabrication of bi-layered stiffness gradient hydrogel. viii) the dotted arrow indicating the direction of gradient and atomic force microscopy (AFM) measurement. B) Young’s moduli gradient measured by AFM. Twelve hydrogels were selected (one gel per batch) and assessed for stiffness, yielding a gradient of 4.0 kPa mm−1, with a range of 1.7 ± 1.2 to 29.6 ± 4.3 kPa (R2 = 0.998, n = 8). Data are presented as mean ± SD.


Figure S2 from Yong Hwee Tan et al. 2024 “Stiffness Mediated-Mechanosensation of Airway Smooth Muscle Cells on Linear Stiffness Gradient Hydrogels”:(A) Correlation of Young’s modulus from macroscale stiffness (UCT) assessment with nanoindentation (AFM), was conducted using cylindrical PA hydrogels of different Acrylamide %/Bis-acrylamide % derived from Tse and Engler [47] 10 %/0.06 %, 10 %/0.1 %, 10 %/0.15 % and 10 %/0.3 % (Linear regression, P < 0.0001, R2 = 0.9288, n = 4). Data are presented as mean  SEM. (B) An example force curve from atomic force microscopy with an approach velocity of 2 μm/s, until a 2 nN trigger force was registered, and retraction of indenter at 10 μm/s. NanoWorld triangular Pyrex-Nitride PNP-TR AFM probes were used to assess the stiffness of the hydrogels with atomic force microscopy.
Figure S2 from Yong Hwee Tan et al. 2024 “Stiffness Mediated-Mechanosensation of Airway Smooth Muscle Cells on Linear Stiffness Gradient Hydrogels”:
(A) Correlation of Young’s modulus from macroscale stiffness (UCT) assessment with nanoindentation (AFM), was conducted using cylindrical PA hydrogels of different Acrylamide %/Bis-acrylamide % derived from Tse and Engler [47] 10 %/0.06 %, 10 %/0.1 %, 10 %/0.15 % and 10 %/0.3 % (Linear regression, P < 0.0001, R2 = 0.9288, n = 4). Data are presented as mean  SEM. (B) An example force curve from atomic force microscopy with an approach velocity of 2 μm/s, until a 2 nN trigger force was registered, and retraction of indenter at 10 μm/s.
*Yong Hwee Tan, Kimberley C. W. Wang, Ian L. Chin, Rowan W. Sanderson, Jiayue Li, Brendan F. Kennedy, Peter B. Noble and Yu Suk Choi
Stiffness Mediated-Mechanosensation of Airway Smooth Muscle Cells on Linear Stiffness Gradient Hydrogels
Advanced Healthcare Materials 2024, 2304254
DOI: https://doi.org/10.1002/adhm.202304254

The article “Stiffness Mediated-Mechanosensation of Airway Smooth Muscle Cells on Linear Stiffness Gradient Hydrogels” by Yong Hwee Tan, Kimberley C. W. Wang, Ian L. Chin, Rowan W. Sanderson, Jiayue Li, Brendan F. Kennedy, Peter B. Noble and Yu Suk Choi is licensed under a Creative Commons Attribution 4.0 International License, which permits use, sharing, adaptation, distribution and reproduction in any medium or format, as long as you give appropriate credit to the original author(s) and the source, provide a link to the Creative Commons license, and indicate if changes were made. The images or other third-party material in this article are included in the article’s Creative Commons license, unless indicated otherwise in a credit line to the material. If material is not included in the article’s Creative Commons license and your intended use is not permitted by statutory regulation or exceeds the permitted use, you will need to obtain permission directly from the copyright holder. To view a copy of this license, visit https://creativecommons.org/licenses/by/4.0/.