Cells communicate with their environments via the plasma membrane and various membrane proteins. Clathrin-mediated endocytosis (CME) plays a central role in such communication and proceeds with a series of multiprotein assembly, deformation of the plasma membrane, and production of a membrane vesicle that delivers extracellular signaling molecules into the cytoplasm.*
In the article “Morphological changes of plasma membrane and protein assembly during clathrin-mediated endocytosis”, Aiko Yoshida, Nobuaki Sakai, Yoshitsugu Uekusa, Yuka Imaoka, Yoshitsuna Itagaki, Yuki Suzuki and Shige H. Yoshimura describe how they utilized their home-built correlative imaging system comprising high-speed atomic force microscopy (HS-AFM) and confocal fluorescence microscopy to simultaneously image morphological changes of the plasma membrane and protein localization during CME in a living cell.*
Overlaying AFM and fluorescence images revealed the dynamics of protein assembly and concomitant morphological changes of the plasma membrane with high spatial resolution. In particular, the authors elucidate the role of actin in the closing step of CME.*
The results revealed a tight correlation between the size of the pit and the amount of clathrin assembled. Actin dynamics play multiple roles in the assembly, maturation, and closing phases of the process, and affects membrane morphology, suggesting a close relationship between endocytosis and dynamic events at the cell cortex. Knock down of dynamin also affected the closing motion of the pit and showed functional correlation with actin.*
An AFM tip-scan–type HS-AFM unit combined with an inverted fluorescence/optical microscope equipped with a phase contrast system and a confocal unit was used for this study.*
The modulation method was set to phase modulation mode to detect AFM tip–sample interactions. A customized NanoWorld Ultra-Short AFM cantilever with an electron beam–deposited sharp AFM tip with a spring constant of 0.1 N m−1 (USC-F0.8-k0.1-T12) was used. *
All observations were performed at 28 °C. The AFM tip was aligned with confocal views as described in the Results section of the article. The images from the confocal microscope and AFM were simultaneously acquired at a scanning rate of 10 s/frame. The captured sequential images were overlaid by using AviUTL (http://spring-fragrance.mints.ne.jp/aviutl/) based on the AFM tip position.
The fluorescence intensity was quantified by Image J software (http://rsbweb.nih.gov/ij/). *
Aligning the confocal image and the AFM image.
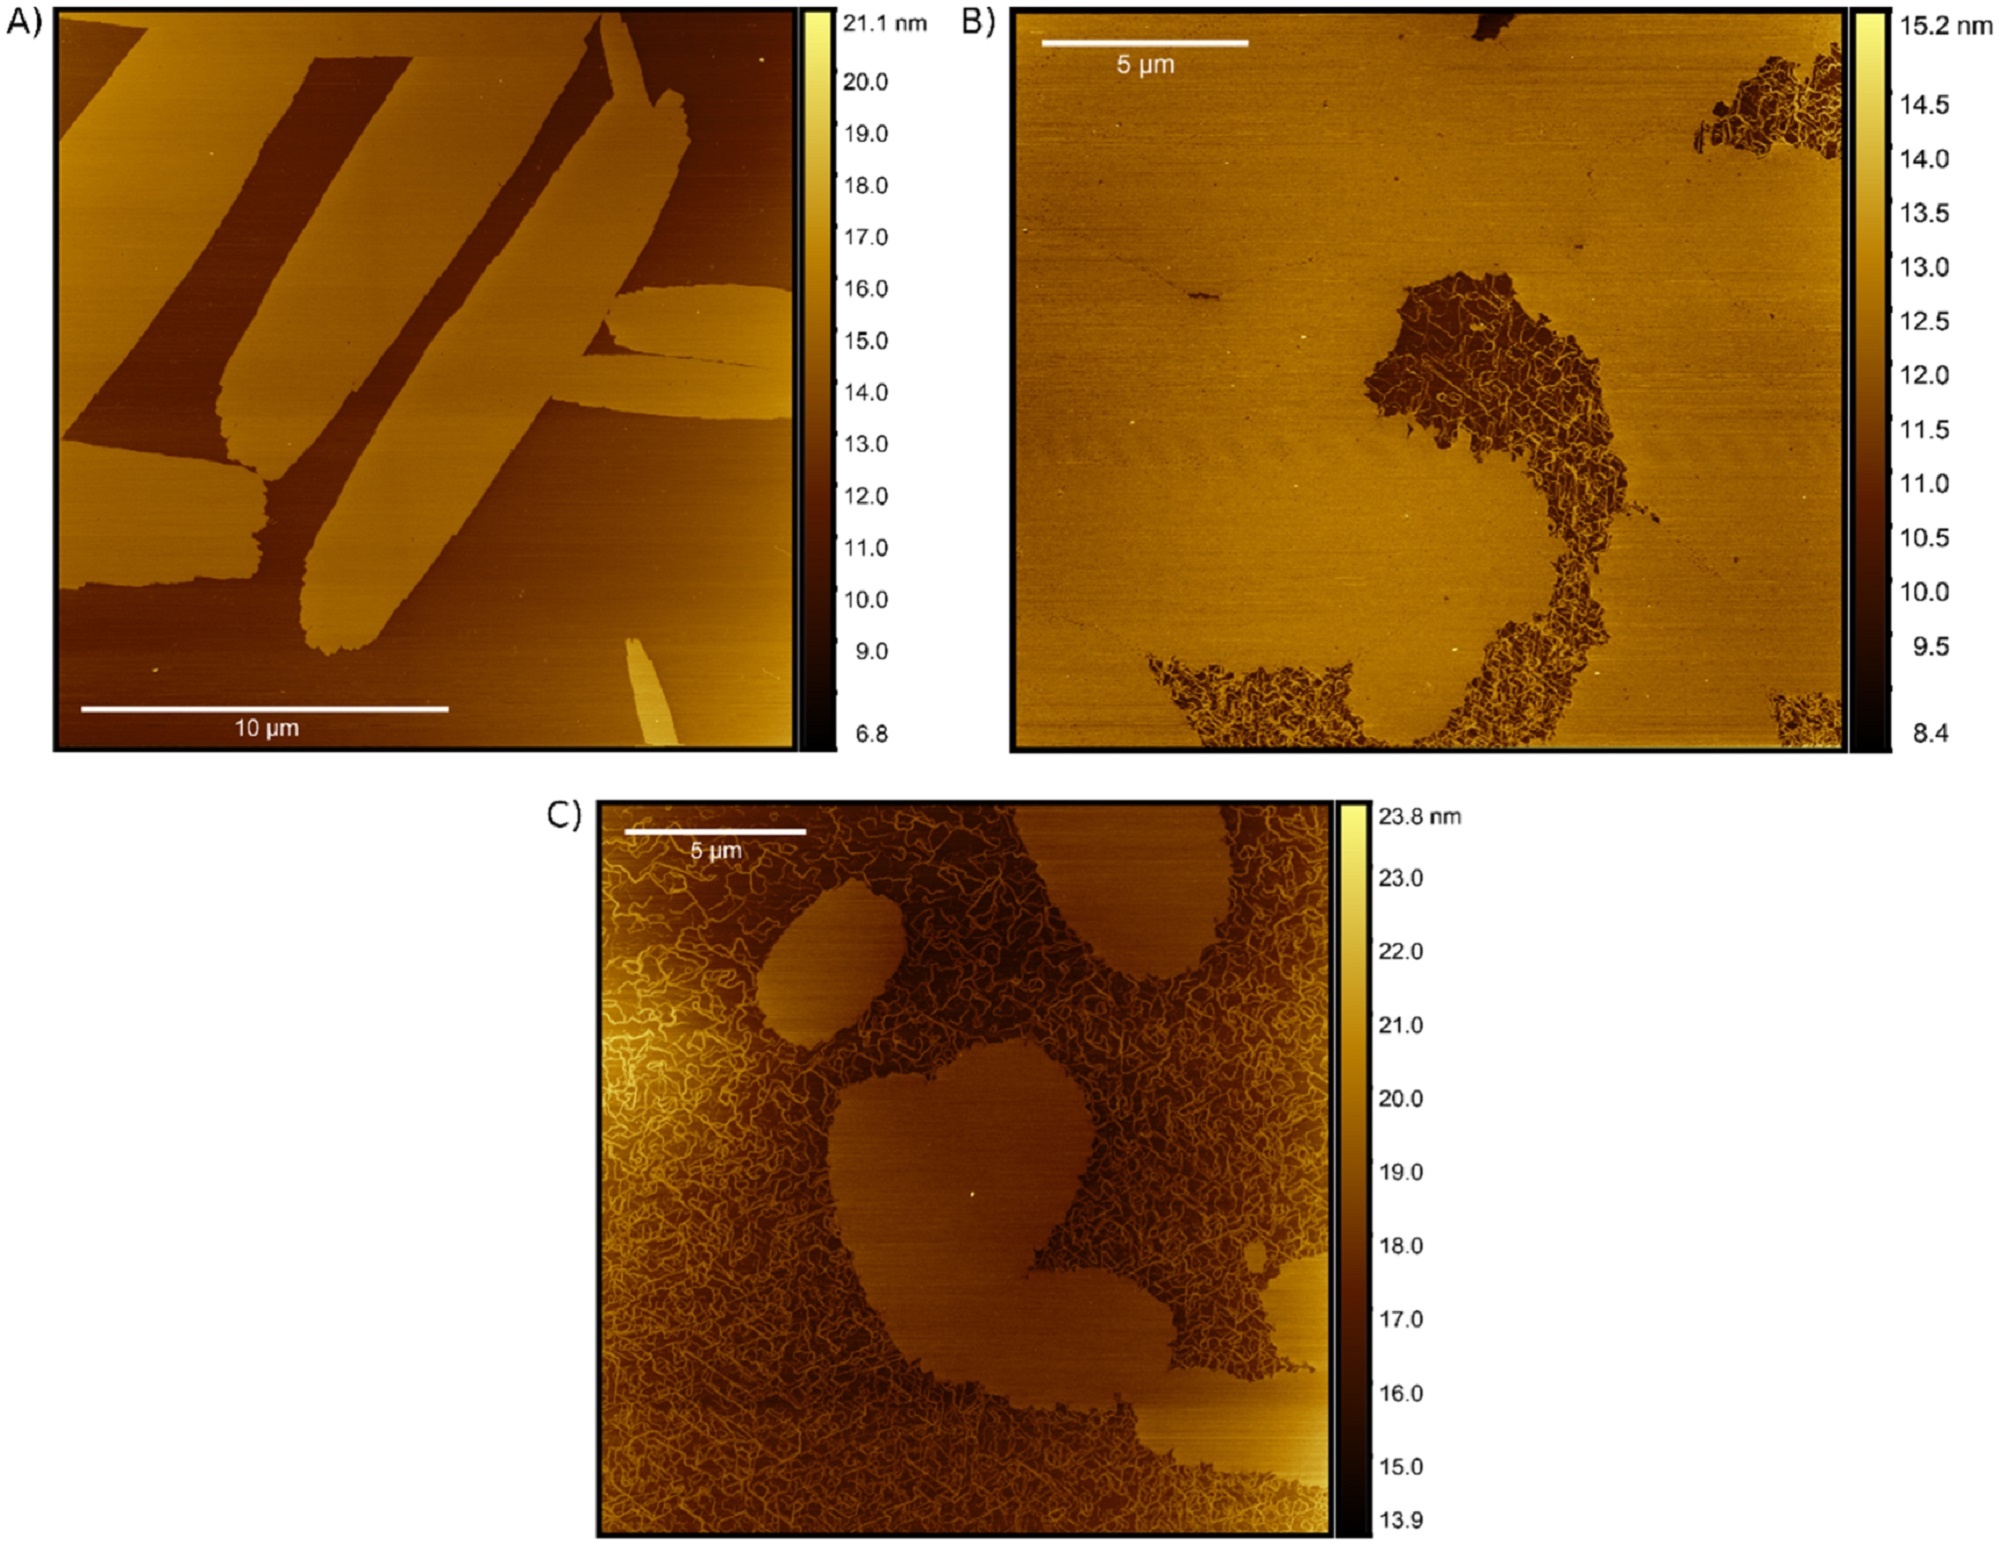
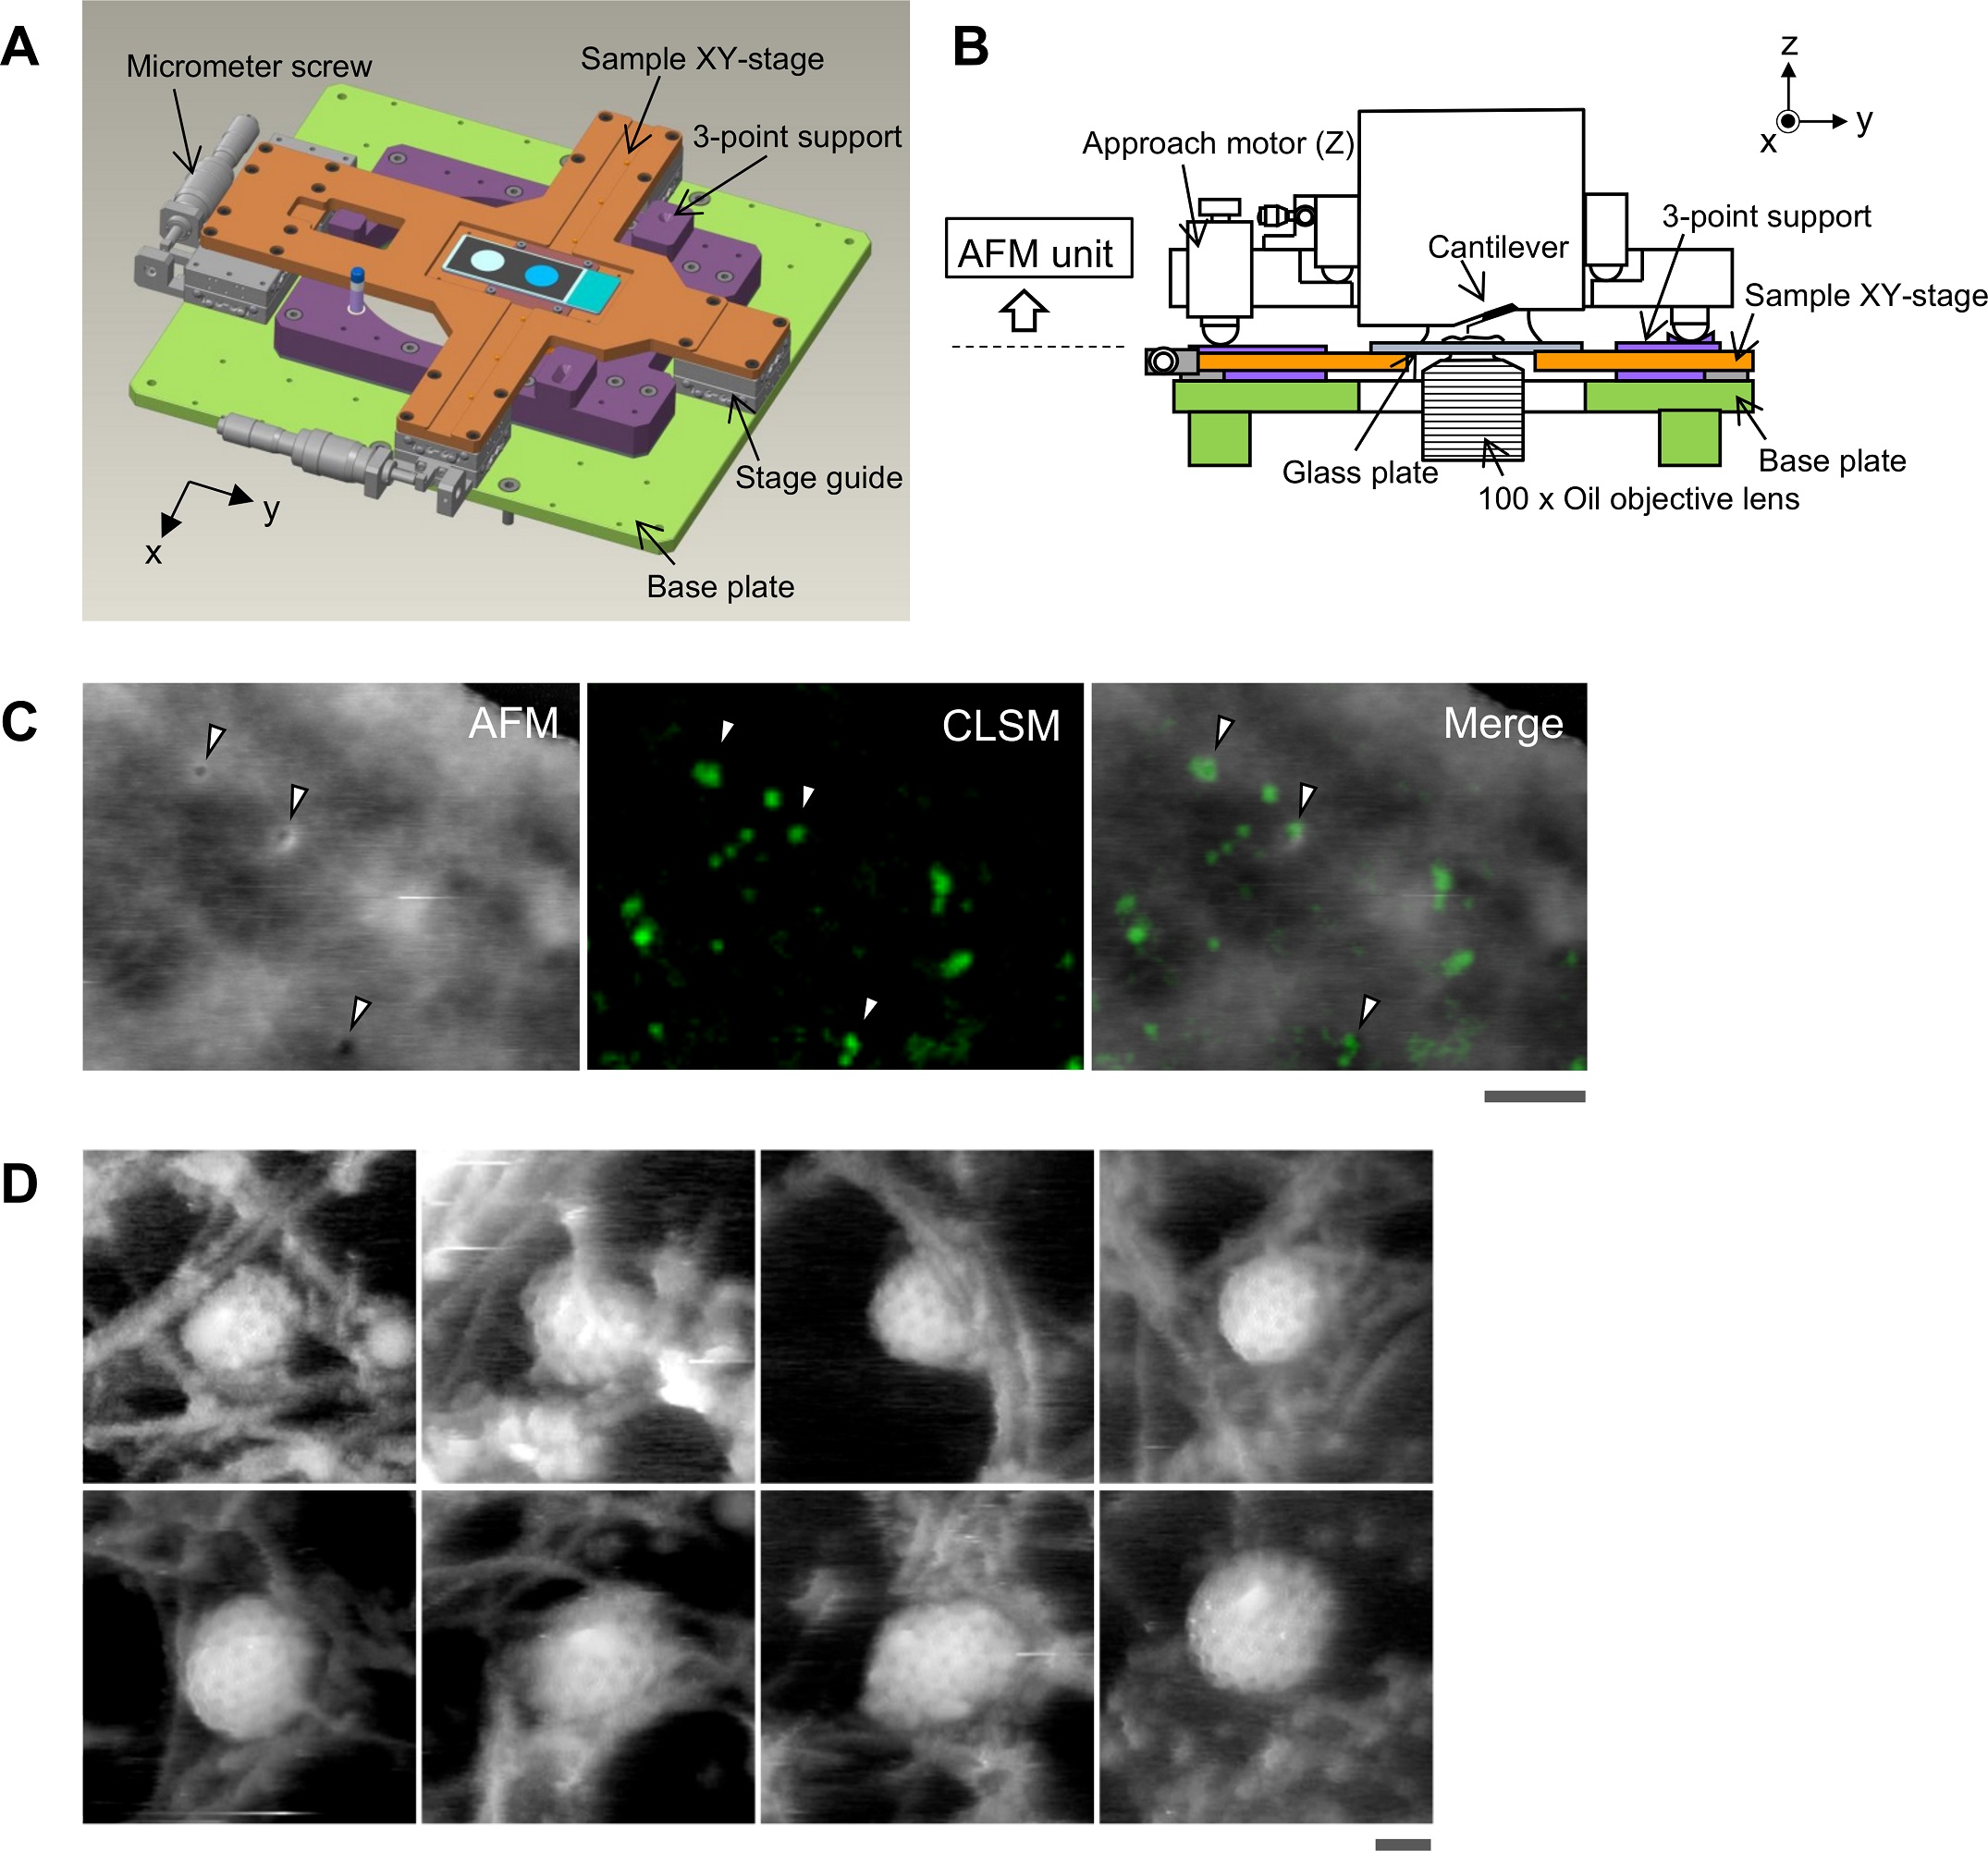
(A) Schematic illustration of the sample stage. A cross-shaped movable XY-stage (orange) is mounted on the base plate (light green) of the inverted optical microscope (IX83) via a stage guide (gray) equipped at each of the 4 ends of the cross. A 3-point support plate (purple) for mounting the AFM scanner unit is fixed on the base plate with a configuration that does not hinder the sliding of the XY-stage along the x-axis and y-axis. These setups allow the sample stage to move independently of the AFM unit and the optical axis. (B) Side view of the HS-AFM unit mounted on the stage illustrated in panel A. (C) Overlaying a confocal image and an AFM image. COS-7 cells expressing EGFP-CLCa were fixed with 5% paraformaldehyde and subjected to AFM (left) and CLSM (middle) imaging. The x-y position of the probe tip was determined as described in S1 Fig. Two images were overlaid (right) based on the x-y center position. Scale bar: 1 μm. Autofluorescence of the probe was much weaker than clathrin spot and could not be detected during the fast scanning. (D) AFM images of CCP on the cytoplasmic surface of the plasma membrane. COS-7 cells were “unroofed” by mild sonication as described in Materials and methods and then fixed with glutaraldehyde. Scale bar: 0.1 μm. AFM, atomic force microscopy; CCP, clathrin-coated pit; CLSM, confocal laser scanning microscopy; COS-7, CV-1 in origin with SV40 gene line 7; EGFP, enhanced green fluorescent protein; EGFP-CLCa, EGFP-fused clathrin light chain a; HS-AFM, high-speed AFM.
https://doi.org/10.1371/journal.pbio.2004786.g001
1 Fig. Aligning confocal and AFM images.
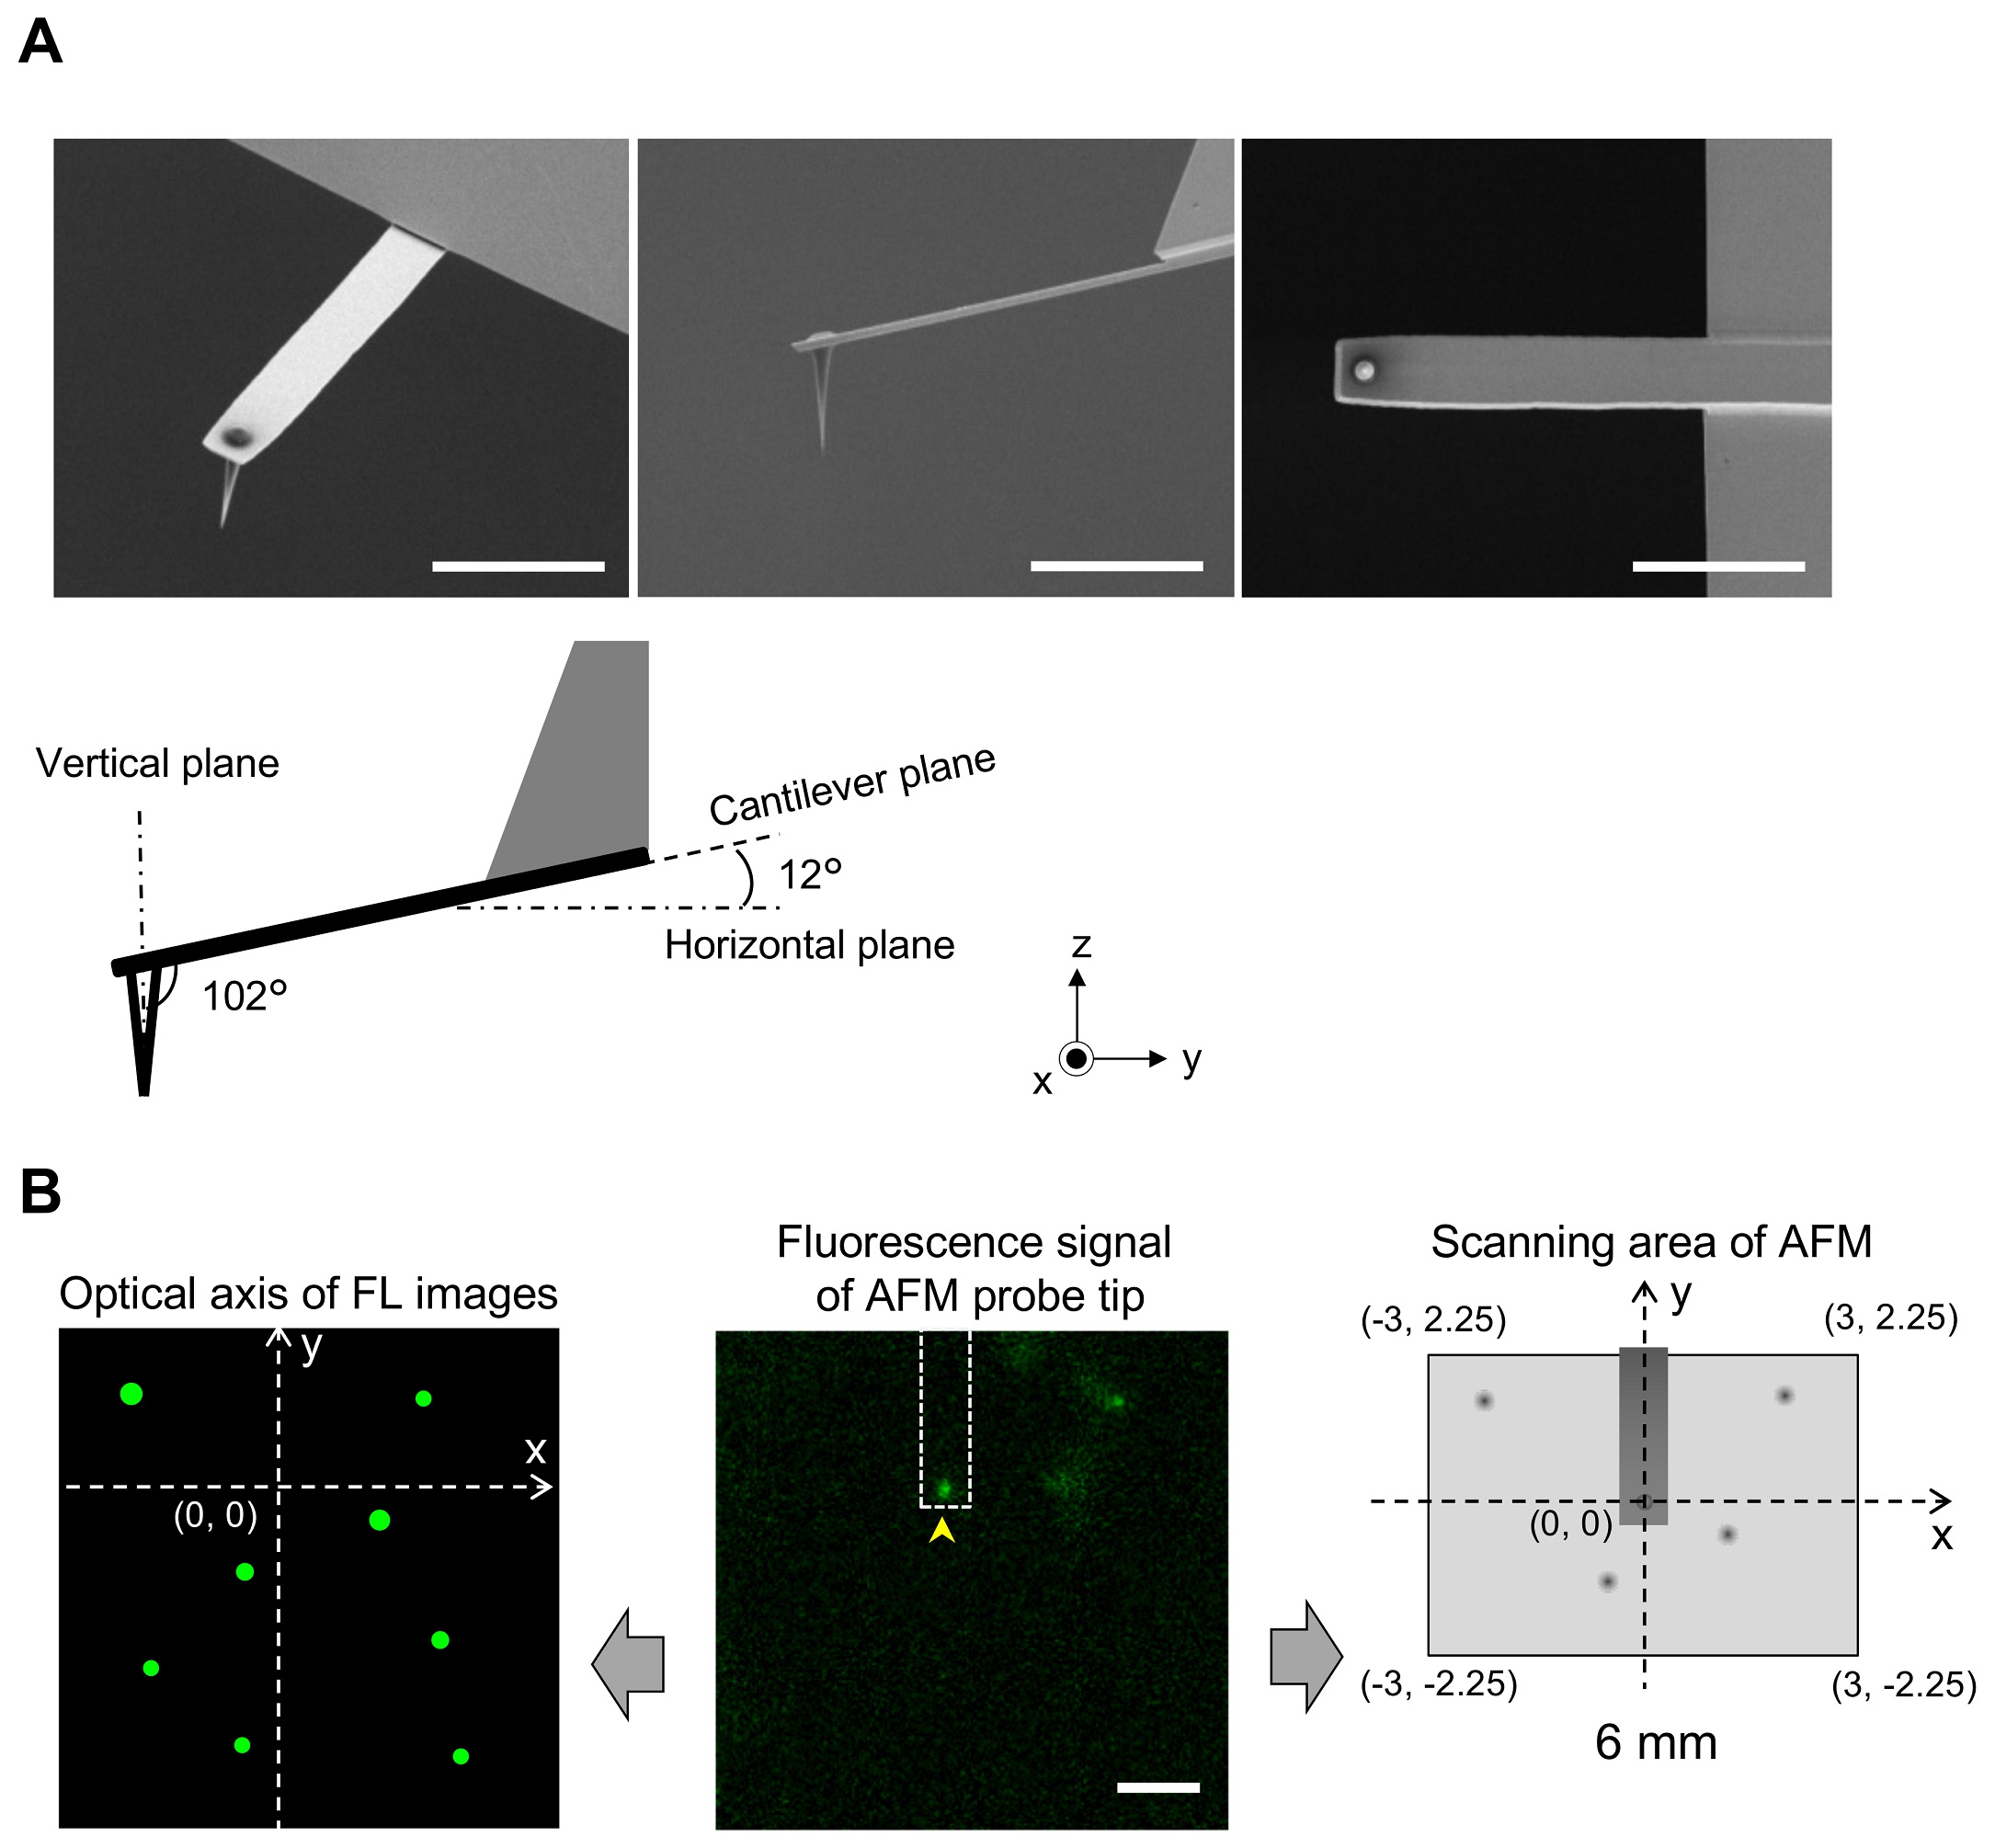
(A) Scanning electron microscopy (SEM) images of a cantilever equipped with an EBD tip with tilt angle of 12°. Scale bar, 5 μm. Note that the cantilever is held on the AFM head unit with a tilt angle of 102° (from the x-y plane) so that the relative tip–sample angle (θ) is 90°. This setup makes it possible to precisely determine the position of the AFM tip. Scale bar, 2 μm. (B) Determining the position of the AFM probe in a fluorescence image. While the AFM probe was attached on the glass surface without scanning, the autofluorescence signal of the probe was imaged by the confocal scanning unit. The observed fluorescence spot (arrowhead in the middle panel) is defined as an origin of the fluorescence image plane (x = 0, y = 0) and used to define the optical axis (left panel). The position of a fluorescence spot derived from EGFP-CLCa was determined on this axis. On the other hand, the scanning area of the AFM scanner covers the area of (−3, 2.25) (left top), (3, 2.25) (right top), (3, −2.25) (right bottom), and (−3, −2.25) (left bottom) (all right panel). By aligning the axis from both images, the x, y position of the AFM image and that of the confocal fluorescence image could be merged. AFM, atomic force microscopy; EBD, electron beam–deposited; EGFP, enhanced green fluorescent protein; EGFP-CLCa, EGFP-fused clathrin light chain a.
https://doi.org/10.1371/journal.pbio.2004786.s001
*Aiko Yoshida, Nobuaki Sakai, Yoshitsugu Uekusa, Yuka Imaoka, Yoshitsuna Itagaki, Yuki Suzuki and Shige H. Yoshimura
Morphological changes of plasma membrane and protein assembly during clathrin-mediated endocytosis
PLoS Biol 16(5) (2018): e2004786
DOI: https://doi.org/10.1371/journal.pbio.2004786
The article “Morphological changes of plasma membrane and protein assembly during clathrin-mediated endocytosis” by Aiko Yoshida, Nobuaki Sakai, Yoshitsugu Uekusa, Yuka Imaoka, Yoshitsuna Itagaki, Yuki Suzuki and Shige H. Yoshimura is licensed under a Creative Commons Attribution 4.0 International License, which permits use, sharing, adaptation, distribution and reproduction in any medium or format, as long as you give appropriate credit to the original author(s) and the source, provide a link to the Creative Commons license, and indicate if changes were made. The images or other third-party material in this article are included in the article’s Creative Commons license, unless indicated otherwise in a credit line to the material. If material is not included in the article’s Creative Commons license and your intended use is not permitted by statutory regulation or exceeds the permitted use, you will need to obtain permission directly from the copyright holder. To view a copy of this license, visit https://creativecommons.org/licenses/by/4.0/.