An explicit model to extract viscoelastic properties of cells from AFM force-indentation curves

The viscoelastic behavior of soft materials, especially cells and tissues, has been extensively investigated due to its importance in many biological and physiological processes that take place during development and even disease.*
Many techniques are used to quantify the mechanical properties of cells, among them micropipette aspiration, optical stretching, deformability cytometry and atomic force microscopy (AFM).*

The AFM, in particular, is still nowadays one of the most popular methods due to its conformity with various material types and geometries and the rather simple analysis process of the material properties.*

For a typical AFM indentation measurement, an AFM cantilever, with a distinct AFM tip shape, moves toward the sample with a predefined velocity and indents it until a prescribed force is reached. The AFM cantilever then moves upwards while detaching from the sample. The deflection and displacement signals of the AFM cantilever are processed further to extract the mechanical properties of the sample. Generally, a Hertzian model is fitted to the approach part of the force-indentation curves to quantify the apparent Young’s modulus.*

When applying the Hertzian model, few assumptions need to be considered, such as the material being homogeneous, isotropic, and linearly elastic. *

Cells and tissues, however, show not only elastic but also viscous behavior that is evident from the hysteresis between the approach and retraction segments of the force-indentation curve. Consequently, assessing this viscoelastic behavior is imperative for understanding the complex nature of biological matter.*

A number of studies utilized AFM to measure the viscoelastic properties of cells in both time and frequency domains.*

Ideally, to investigate the whole range of the viscoelastic behavior one needs to probe the material for a long time and observe its response or apply oscillatory signals and evaluate its phase lag. These approaches require the user to alter the probing method and add several steps to account for the time-dependent drift or the effect of the hydrodynamic drag of the surrounding medium. On top of that, in many of studies, the biological materials were probed with a linear approach followed by immediate retraction. The force-indentation curves from these studies were used to evaluate the apparent elastic modulus of the probed material using the standard Hertzian model. However, additional information concerning energy dissipation can still be extracted from the same curves to evaluate the viscoelasticity of the material.*

In the article “An explicit model to extract viscoelastic properties of cells from AFM force-indentation curves”, Shada Abuhattum, Dominic Mokbel, Paul Müller, Despina Soteriou, Jochen Guck and Sebastian Aland propose a new fitting model to extract the viscoelastic properties of soft materials from AFM force-indentation curves. *

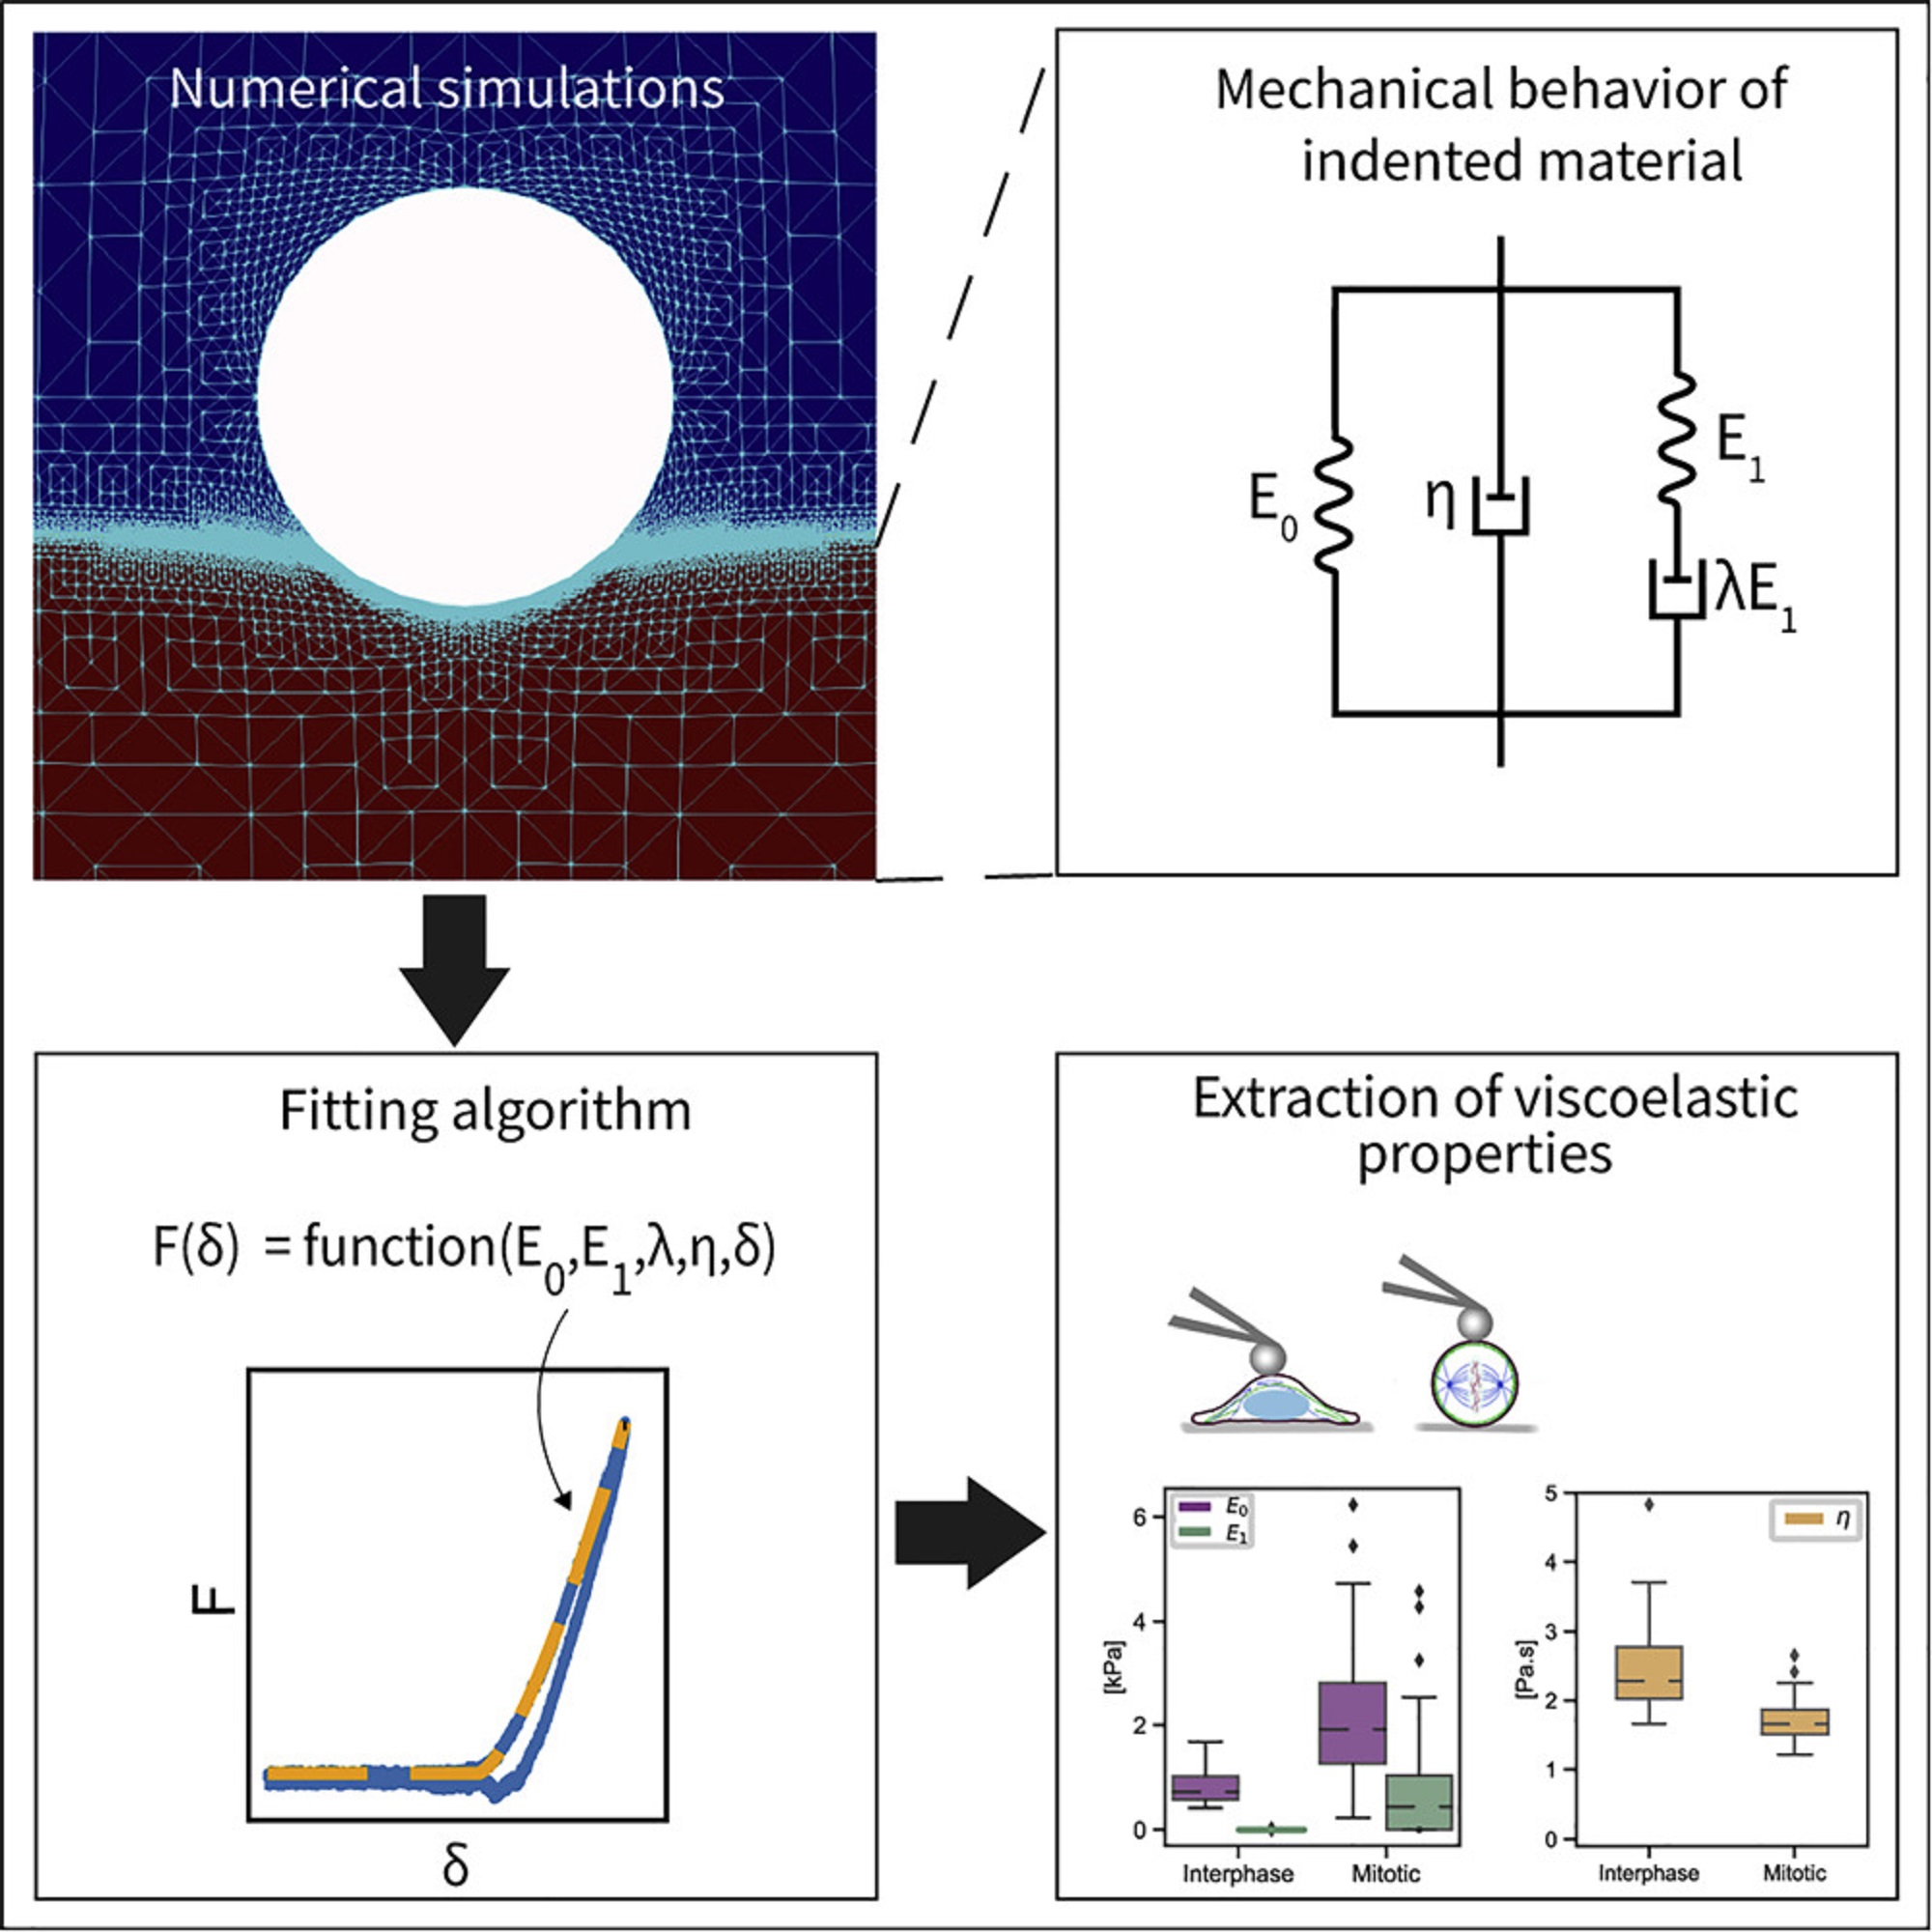
To construct the explicit relation of force and indentation, the authors first use a generalization of Maxwell and Kelvin-Voigt models to describe soft materials, and numerically simulate the indentation of such material with a spherical indenter. *

Shada Abuhattum et al. show that the proposed Kelvin-Voigt-Maxwell (KVM) model adequately captures the force-indentation curves of materials having different mechanical characteristics. *

Based on the simulation results, Shada Abuhattum et al. further propose an explicit force-indentation relation to be fitted to the force-indentation curves. This explicit relation simplifies the association of the mechanical properties with physically meaningful components and processes.
Finally, the authors apply the fitting model to a number of samples, including poroelastic and viscoelastic hydrogels as well as HeLa cells in two different cell cycle phases, interphase and mitotic. *

Shada Abuhattum et al. demonstrate that the distinct nature of the hydrogels, arising from the different crosslinking mechanisms, can be described with the fitting model. For the HeLa cells, the mitotic cells had a higher apparent elasticity and a lower apparent viscosity, implying a stiffer actin cortex and a diluted cytoplasm protein concentration, when compared with interphase cells.*

Their findings demonstrate that the proposed model can reliably extract viscoelastic properties from conventional force-indentation curves. Moreover, the model is able to assess the contribution of the different elastic and viscous elements, and thus allows a direct comparison between the viscoelastic nature of different materials.*

AFM measurements were preformed using a commercially available Atomic Force Microscope. To indent the samples, NanoWorld Pyrex-Nitride tipless AFM cantilevers PNP-TR-TL with a nominal spring constant of 0.08 mN/m were modified by gluing 5 μm diameter polystyrene beads to the underside of the AFM cantilevers using two component glue.*

The AFM cantilevers were calibrated prior to each experiment using the thermal noise method and their accurate spring constant ranged between 0.047-0.059 mN/m. For PAAm and agarose hydrogels, the AFM cantilever was lowered with a constant velocity (5, 10, or 15 μm/s) toward the surface of the sample until a force of 2 nN for agarose and 4 nN for PAAm was reached. These force set points accounted for an indentation in the range of 0.5–1 μm. For HeLa cells, the AFM cantilever was lowered with a constant velocity of 2 μm/s and the cells were indented until a force of 2 nN was reached, which accounted for an indentation depth in the range of 0.5–1.5 μm.*

Graphical abstract for the article “An explicit model to extract viscoelastic properties of cells from AFM force-indentation curves” by Shada Abuhattum, Dominic Mokbel, Paul Müller, Despina Soteriou, Jochen Guck and Sebastian Aland consisting of 4 squares. showing a symbol for numerical simulations in the top left square, an arrow points to the bottom left square showing a graph and a formula as symbols for fitting algorithm a further arrow points to the bottom right square symbolizing the extraction of viscoelastic properties. The pictures in this square show on the left a drawing of the end of a tipless AFM cantilever on which a sphere is glued pressing on a cell, on the right of this picture there is another picture showing the end of a tipless AFM cantilever on which a sphere is glued pressing on a sphere or bead, underneath a graph symbolizing the mechanical properties of hydrogels is shown. Above this square on the top right a graph with a symbol for the mechanical behavior of the indented material is shown.NanoWorld Pyrex-Nitride tipless AFM cantilevers PNP-TR-TL with a nominal spring constant of 0.08 mN/m were modified by gluing 5 μm diameter polystyrene beads to the underside of the AFM cantilevers using two component glue were used for the atomic force microscopy indentation measurements described in the cited article.
Graphical abstract for the article “An explicit model to extract viscoelastic properties of cells from AFM force-indentation curves” by Shada Abuhattum at al. 2022. NanoWorld Pyrex-Nitride tipless AFM cantilevers PNP-TR-TL with a nominal spring constant of 0.08 mN/m were modified by gluing 5 μm diameter polystyrene beads to the underside of the AFM cantilevers using two component glue were used for the atomic force microscopy indentation measurements described in the cited article.

*Shada Abuhattum, Dominic Mokbel, Paul Müller, Despina Soteriou, Jochen Guck and Sebastian Aland
An explicit model to extract viscoelastic properties of cells from AFM force-indentation curves
iScience, Volume 25, ISSUE 4, 104016, April 15, 2022
DOI: https://doi.org/10.1016/j.isci.2022.104016

The article “An explicit model to extract viscoelastic properties of cells from AFM force-indentation curves” by Shada Abuhattum, Dominic Mokbel, Paul Müller, Despina Soteriou, Jochen Guck and Sebastian Aland is licensed under a Creative Commons Attribution 4.0 International License, which permits use, sharing, adaptation, distribution and reproduction in any medium or format, as long as you give appropriate credit to the original author(s) and the source, provide a link to the Creative Commons license, and indicate if changes were made. The images or other third-party material in this article are included in the article’s Creative Commons license, unless indicated otherwise in a credit line to the material. If material is not included in the article’s Creative Commons license and your intended use is not permitted by statutory regulation or exceeds the permitted use, you will need to obtain permission directly from the copyright holder. To view a copy of this license, visit https://creativecommons.org/licenses/by/4.0/.

A beginner’s guide to the Characterization of Hydrogel Microarchitecture for Cellular Applications

Hydrogel materials show a number of properties which make them interesting candidates to be utilized to mimic the extracellular matrix (ECM). Therefore, these materials are attractive for use in biological applications such as tissue engineering, cell culture 3D bioprinting and more.

Are you planning to use hydrogels for the first time in your research?

Then have a look at the insightful article “A beginner’s guide to the Characterization of Hydrogel Microarchitecture for Cellular Applications” by Francisco Drusso Martinez-Garcia, Tony Fischer, Alexander Hayn, Claudia Tanja Mierke, Janette Kay Burgess and Martin Conrad Harmsen.

In their article the authors describe and evaluate the different technologies that are most commonly used to assess hydrogel microarchitecture.

Francisco Drusso Martinez-Garcia et al. explain the working principle of the various methods and also discuss the merits and limitations of each of them in view of their usefulness for the characterization of hydrogels.

They introduce and explore the pros and cons of the following methods: Scanning Electron Microscopy (SEM), Cryogenic Scanning Electron Microscopy (Cryo-SEM), Environmental Scanning Electron Microscopy (ESEM), Micro-Computed Tomography (µ-CT), Confocal Laser Scanning Microscopy (CLSM), Second Harmonic Generation and Atomic Force Microscopy (AFM).*

Atomic force microscopy (AFM) can be used to investigate the hydrogel surface topology as well as a hydrogel’s mechanical properties. The latter can be achieved through mathematical modelling of force-distance curves.

When using the AFM to characterize the elasticity of a hydrogel sample it is essential to take the stiffness of the investigated material into account when choosing what kind of AFM probe to use for these experiments.

If an AFM cantilever used for probing a soft sample is too stiff (if the force constant/spring constant is too high) this might result in a poor signal-to-noise ratio.

If a soft AFM probe (an AFM probe with an AFM cantilever with a low force constant) is chosen to investigate a soft material this should lead to a better signal-to-noise ratio. On the other hand, if an AFM cantilever is too soft (if the force constant is too low) then it might not be stiff enough to indent the investigated material.

Another critical factor is the shape and the size of the AFM tip.

Spheroidal AFM probes might stick to the material, resulting in artefacts, disrupted force–distance curves, or even damaged AFM cantilevers. If the AFM tip is much smaller than the pore size of the hydrogel, it might get stuck in the fibrous network microarchitecture.

On the other hand, if the spherical AFM tip, e.g. as in colloidal AFM probes (a sphere glued to end of a tipless AFM cantilever), is too large, the weight of the sphere can have a negative influence on the spring characteristics of the AFM cantilever.

All these factors and more as described in the cited article have to be carefully weighed before deciding on the settings of the atomic force microscope and choosing an AFM probe for the investigation of a specific hydrogel.

NanoWorld tipless ArrowTL2 cantilever arrays with polystyrene beads glued to them were used by the authors of this beginner’s guide to achieve the AFM data presented in the article.*

Figure 6. from Francisco Drusso Martinez-Garcia et al. 2022: Atomic force microscopy. (A) Equipment. (B) Schematic of an AFM setup with a four-quadrant photodiode (1), in which the four-quadrant photodiode (1) receives a laser (2) reflected from a cantilever (3), in this case positioned over a hydrogel (4) mounted in a piezo stage (5). For example, the height differences in a sample (4) are measured by adjusting the stage using piezo elements (5) to counter the cantilever bending on a nanometer scale. (C) The AFM can then generate a surface heightmap of the hydrogels such as a GelMA hydrogel (shown). AFM can also be used to determine the mechanical properties of hydrogels. (D) Schematic of the AFM technique to determine the elastic moduli of hydrogels with a tipless cantilever (1), spheroidal probe (2, red), hydrogel (3), and stiff substrate (4). As the cantilever represents a spring with a known spring constant, the cantilever bending due to elastic counterforces exerted by the soft material is correlated with the piezo stage height (4). (E) The so-called force–distance curves are recorded. Data from a collagen type-I hydrogel (3.0 g/L) are shown. (F) Young’s moduli of a 1.5 g/L and 3.0 g/L collagen type-I hydrogel. Outliers indicated by ◆. AFM equipment detailed in Appendix A of the cited article. NanoWorld tipless ArrowTL2 cantilever arrays with polystyrene beads glued to them were used by the authors of this beginner’s guide to achieve the AFM data presented in the article.
Figure 6. from Francisco Drusso Martinez-Garcia et al. 2022:
Atomic force microscopy. (A) Equipment. (B) Schematic of an AFM setup with a four-quadrant photodiode (1), in which the four-quadrant photodiode (1) receives a laser (2) reflected from a cantilever (3), in this case positioned over a hydrogel (4) mounted in a piezo stage (5). For example, the height differences in a sample (4) are measured by adjusting the stage using piezo elements (5) to counter the cantilever bending on a nanometer scale. (C) The AFM can then generate a surface heightmap of the hydrogels such as a GelMA hydrogel (shown). AFM can also be used to determine the mechanical properties of hydrogels. (D) Schematic of the AFM technique to determine the elastic moduli of hydrogels with a tipless cantilever (1), spheroidal probe (2, red), hydrogel (3), and stiff substrate (4). As the cantilever represents a spring with a known spring constant, the cantilever bending due to elastic counterforces exerted by the soft material is correlated with the piezo stage height (4). (E) The so-called force–distance curves are recorded. Data from a collagen type-I hydrogel (3.0 g/L) are shown. (F) Young’s moduli of a 1.5 g/L and 3.0 g/L collagen type-I hydrogel. Outliers indicated by ◆. AFM equipment detailed in Appendix A of the cited article.


NanoWorld tipless Arrow-TL2 AFM probe array with two tipless AFM cantilevers
NanoWorld® Arrow™ TL2 AFM probes are tipless AFM cantilevers for special applications. They can for example be used for attaching spheres and other objects to the free end of the AFM cantilever, or for functionalizing and sensing applications.
The Arrow™ TL2 probes are optionally available with a sample facing side gold coating (Arrow™ TL2Au).

*Francisco Drusso Martinez-Garcia, Tony Fischer, Alexander Hayn, Claudia Tanja Mierke, Janette Kay Burgess and Martin Conrad Harmsen
A Beginner’s Guide to the Characterization of Hydrogel Microarchitecture for Cellular Applications
Gels 2022, 8(9), 535
DOI: https://doi.org/10.3390/gels8090535

The article “A Beginner’s Guide to the Characterization of Hydrogel Microarchitecture for Cellular Applications” by Francisco Drusso Martinez-Garcia, Tony Fischer, Alexander Hayn, Claudia Tanja Mierke, Janette Kay Burgess and Martin Conrad Harmsen is licensed under a Creative Commons Attribution 4.0 International License, which permits use, sharing, adaptation, distribution and reproduction in any medium or format, as long as you give appropriate credit to the original author(s) and the source, provide a link to the Creative Commons license, and indicate if changes were made. The images or other third-party material in this article are included in the article’s Creative Commons license, unless indicated otherwise in a credit line to the material. If material is not included in the article’s Creative Commons license and your intended use is not permitted by statutory regulation or exceeds the permitted use, you will need to obtain permission directly from the copyright holder. To view a copy of this license, visit https://creativecommons.org/licenses/by/4.0/.

Cell surface fluctuations regulate early embryonic lineage sorting

In development, lineage segregation is coordinated in time and space. An important example is the mammalian inner cell mass, in which the primitive endoderm (PrE, founder of the yolk sac) physically segregates from the epiblast (EPI, founder of the fetus). While the molecular requirements have been well studied, the physical mechanisms determining spatial segregation between EPI and PrE remain elusive.*

In the article “Cell surface fluctuations regulate early embryonic lineage sorting” Ayaka Yanagida, Elena Corujo-Simon, Christopher K. Revell, Preeti Sahu, Giuliano G. Stirparo, Irene M. Aspalter, Alex K. Winkel, Ruby Peters, Henry De Belly, Davide A.D. Cassani, Sarra Achouri     Raphael Blumenfeld, Kristian Franze, Edouard Hannezo, Ewa K. Paluch, Jennifer Nichols and Kevin J. Chalut investigate the mechanical basis of EPI and PrE sorting. *

The authors find that rather than the differences in static cell surface mechanical parameters as in classical sorting models, it is the differences in surface fluctuations that robustly ensure physical lineage sorting.*

These differential surface fluctuations systematically correlate with differential cellular fluidity, which Ayaka Yanagida et al. propose together constitute a non-equilibrium sorting mechanism for EPI and PrE lineages. By combining experiments and modeling, A. Yanagida et al. identify cell surface dynamics as a key factor orchestrating the correct spatial segregation of the founder embryonic lineages.*

The surface tension of cells was measured using an Atomic Force Microscopy (AFM) based technique with a commercially available stand-alone platform for cell adhesion and cytomechanics studies mounted on an inverted confocal microscope.*

pEPI (epiblast , EPI, founder of the fetus) and pPrE (primitive endoderm, founder of the yolk sac ) tension measurements were performed using NanoWorld ARROW-TL1Au tipless silicon AFM cantilevers (nominal spring constant of 0.03 N/m).*
Sensitivity was calibrated by acquiring a force curve on a glass coverslip. Spring constant was calibrated by the thermal noise fluctuation method. Z-length parameter and setpoint force were set at 30 μm and 10 nN, respectively. Constant height mode was selected. The measurement was carried on by lowering the tipless AFM cantilever onto an empty area next to a target cell. Once the cantilever retracted (by roughly 30 μm), it was positioned above the target cell and run a compression for 200 seconds. During the constant height compression, the force acting on the AFM cantilever was recorded. After initial force relaxation, the resulting force value was used to extract surface tension.*

ES cells tension measurements were performed using the same commercial platform for cell adhesion and cytomechanics studies and a DSD2 Differential Spinning Disk both mounted on an inverted microscope.*

NanoWorld tipless silicon AFM cantilevers of the ARROW-TL1 type were chosen (nominal spring constant of 0.03 N/m). Sensitivity was calibrated by acquiring a force curve on glass. Spring constant was calibrated by the thermal noise fluctuation method. Z-length parameter and setpoint force were set at 80 μm and 4 nN, respectively. Constant height mode was selected. The measurement was carried on by lowering the tipless AFM cantilever onto an empty area next to a target cell. Once the AFM cantilever retracted (by roughly 80 μm), it was positioned above the target cell and a compression was run for 50 seconds. During the constant height compression, the force acting on the AFM cantilever was recorded. After initial force relaxation, the resulting force value was used to extract surface tension. A confocal stack was acquired using a ×40/1.1 NA water immersion objective.*

Figure 4 from Ayaka Yanagida et al. “Cell surface fluctuations regulate early embryonic lineage sorting”:Differences in ezrin-mediated surface fluctuations regulate cell sorting (A) Representative images of constitutively active Ezrin-IRES-mCherry (CA-EZR) ES cells, showing a high degree of pERM variability in the low mCherry-expressing ES cells. Surface fluctuations of single CA-EZR cells without Dox and WT H2B-BFP, and CA-EZR ES cells with or without Dox in 2i+LIF. L, M, and H indicate low, medium, and high expression of mCherry as assessed by the 3-quantiles of expression in the mCherry-expressing cells. Surface fluctuations were normalized by the mean of the Dox− surface fluctuations in each of the experiments or the mean of the WT H2B-BFP surface fluctuations. p values were calculated using one-way ANOVA, with the p values above each group representing the outcome of pairwise comparison with Dox−, and the p value above all values in CA-EZR Dox+ condition representing the comparison of all groups. (B) The surface tension of dissociated Dox-treated CA-EZR ES cells measured using the AFM technique presented in Chugh et al., 2017 is plotted against the intensity of mCherry to show that there is no correlation between CA-EZR expression and surface tension. On the right is the surface tension of dissociated WT H2B-BFP ES cells and Dox-treated CA-EZR ES cells. p value was calculated by two-way ANOVA using cell type and experimental replicate as variables. (C) θ of the homotypic doublets that can be formed from CA-EZR ES cells with or without Dox. (D) Representative images of CA-EZR ES cells and WT H2B-BFP ES cells aggregated with or without Dox. The line drawn through the center of the aggregates represents the line over which we found an intensity profile in (E). (E) Representative comparison of BFP and mCherry line scan signals in the CA-EZR and H2B-BFP ES cells aggregates with or without Dox, using the line across the images in (D). (F) Schematic showing how the radial average (dipole moment) R is calculated, along with model examples of R for distributions shown. (G) R of aggregates of CA-EZR and H2B-BFP ES cells. pEPI (epiblast , EPI, founder of the fetus) and pPrE (primitive endoderm, founder of the yolk sac ) tension measurements were performed using NanoWorld ARROW-TL1Au tipless silicon AFM cantilevers. ES cells tension measurements were performed using NanoWorld tipless silicon AFM cantilevers of the ARROW-TL1 type were chosen (nominal spring constant of 0.03 N/m).
Figure 4 from Ayaka Yanagida et al. “Cell surface fluctuations regulate early embryonic lineage sorting”:
Differences in ezrin-mediated surface fluctuations regulate cell sorting
(A) Representative images of constitutively active Ezrin-IRES-mCherry (CA-EZR) ES cells, showing a high degree of pERM variability in the low mCherry-expressing ES cells. Surface fluctuations of single CA-EZR cells without Dox and WT H2B-BFP, and CA-EZR ES cells with or without Dox in 2i+LIF. L, M, and H indicate low, medium, and high expression of mCherry as assessed by the 3-quantiles of expression in the mCherry-expressing cells. Surface fluctuations were normalized by the mean of the Dox− surface fluctuations in each of the experiments or the mean of the WT H2B-BFP surface fluctuations. p values were calculated using one-way ANOVA, with the p values above each group representing the outcome of pairwise comparison with Dox−, and the p value above all values in CA-EZR Dox+ condition representing the comparison of all groups.
(B) The surface tension of dissociated Dox-treated CA-EZR ES cells measured using the AFM technique presented in Chugh et al., 2017
is plotted against the intensity of mCherry to show that there is no correlation between CA-EZR expression and surface tension. On the right is the surface tension of dissociated WT H2B-BFP ES cells and Dox-treated CA-EZR ES cells. p value was calculated by two-way ANOVA using cell type and experimental replicate as variables.
(C) θ of the homotypic doublets that can be formed from CA-EZR ES cells with or without Dox.
(D) Representative images of CA-EZR ES cells and WT H2B-BFP ES cells aggregated with or without Dox. The line drawn through the center of the aggregates represents the line over which we found an intensity profile in (E).
(E) Representative comparison of BFP and mCherry line scan signals in the CA-EZR and H2B-BFP ES cells aggregates with or without Dox, using the line across the images in (D).
(F) Schematic showing how the radial average (dipole moment) R is calculated, along with model examples of R for distributions shown.
(G) R of aggregates of CA-EZR and H2B-BFP ES cells.

*Ayaka Yanagida, Elena Corujo-Simon, Christopher K. Revell, Preeti Sahu, Giuliano G. Stirparo, Irene M. Aspalter, Alex K. Winkel, Ruby Peters, Henry De Belly, Davide A.D. Cassani, Sarra Achouri     Raphael Blumenfeld, Kristian Franze, Edouard Hannezo, Ewa K. Paluch, Jennifer Nichols and Kevin J. Chalut
Cell surface fluctuations regulate early embryonic lineage sorting
Cell, Volume 185, Issue 5, 3 March 2022, Pages 777-793.e20
DOI: https://doi.org/10.1016/j.cell.2022.01.022

The article “Cell surface fluctuations regulate early embryonic lineage sorting” by Ayaka Yanagida, Elena Corujo-Simon, Christopher K. Revell, Preeti Sahu, Giuliano G. Stirparo, Irene M. Aspalter, Alex K. Winkel, Ruby Peters, Henry De Belly, Davide A.D. Cassani, Sarra Achouri     Raphael Blumenfeld, Kristian Franze, Edouard Hannezo, Ewa K. Paluch, Jennifer Nichols and Kevin J. Chalut is licensed under a Creative Commons Attribution 4.0 International License, which permits use, sharing, adaptation, distribution and reproduction in any medium or format, as long as you give appropriate credit to the original author(s) and the source, provide a link to the Creative Commons license, and indicate if changes were made. The images or other third-party material in this article are included in the article’s Creative Commons license, unless indicated otherwise in a credit line to the material. If material is not included in the article’s Creative Commons license and your intended use is not permitted by statutory regulation or exceeds the permitted use, you will need to obtain permission directly from the copyright holder. To view a copy of this license, visit https://creativecommons.org/licenses/by/4.0/.