Nanoscale resolved mapping of the dipole emission of hBN color centers with a scattering-type scanning near-field optical microscope

Color centers in hexagonal boron nitride (hBN) are promising candidates as quantum light sources for future technologies. *

In the article “Nanoscale resolved mapping of the dipole emission of hBN color centers with a scattering-type scanning near-field optical microscope “, Iris Niehues, Daniel Wigger, Korbinian Kaltenecker, Annika Klein-Hitpass , Philippe Roell, Aleksandra K. Dąbrowska, Katarzyna Ludwiczak, Piotr Tatarczak, Janne O. Becker , Robert Schmidt, Martin Schnell, Johannes Binder, Andrzej Wysmołek and Rainer Hillenbrand utilize a scattering-type near-field optical microscope (s-SNOM) to study the photoluminescence (PL) emission characteristics of such quantum emitters in metalorganic vapor phase epitaxy grown hBN. *

On the one hand, Iris Niehues et al. demonstrate direct near-field optical excitation and emission through interaction with the nanofocus of the AFM tip resulting in a subdiffraction limited tip-enhanced PL hotspot. *

On the other hand, the authors show that indirect excitation and emission via scattering from the AFM tip significantly increases the recorded PL intensity. This demonstrates that the tip-assisted PL (TAPL) process efficiently guides the generated light to the detector. *

Iris Niehues et al. apply the TAPL method to map the in-plane dipole orientations of the hBN color centers on the nanoscale. This work promotes the widely available s-SNOM approach to applications in the quantum domain including characterization and optical control. *

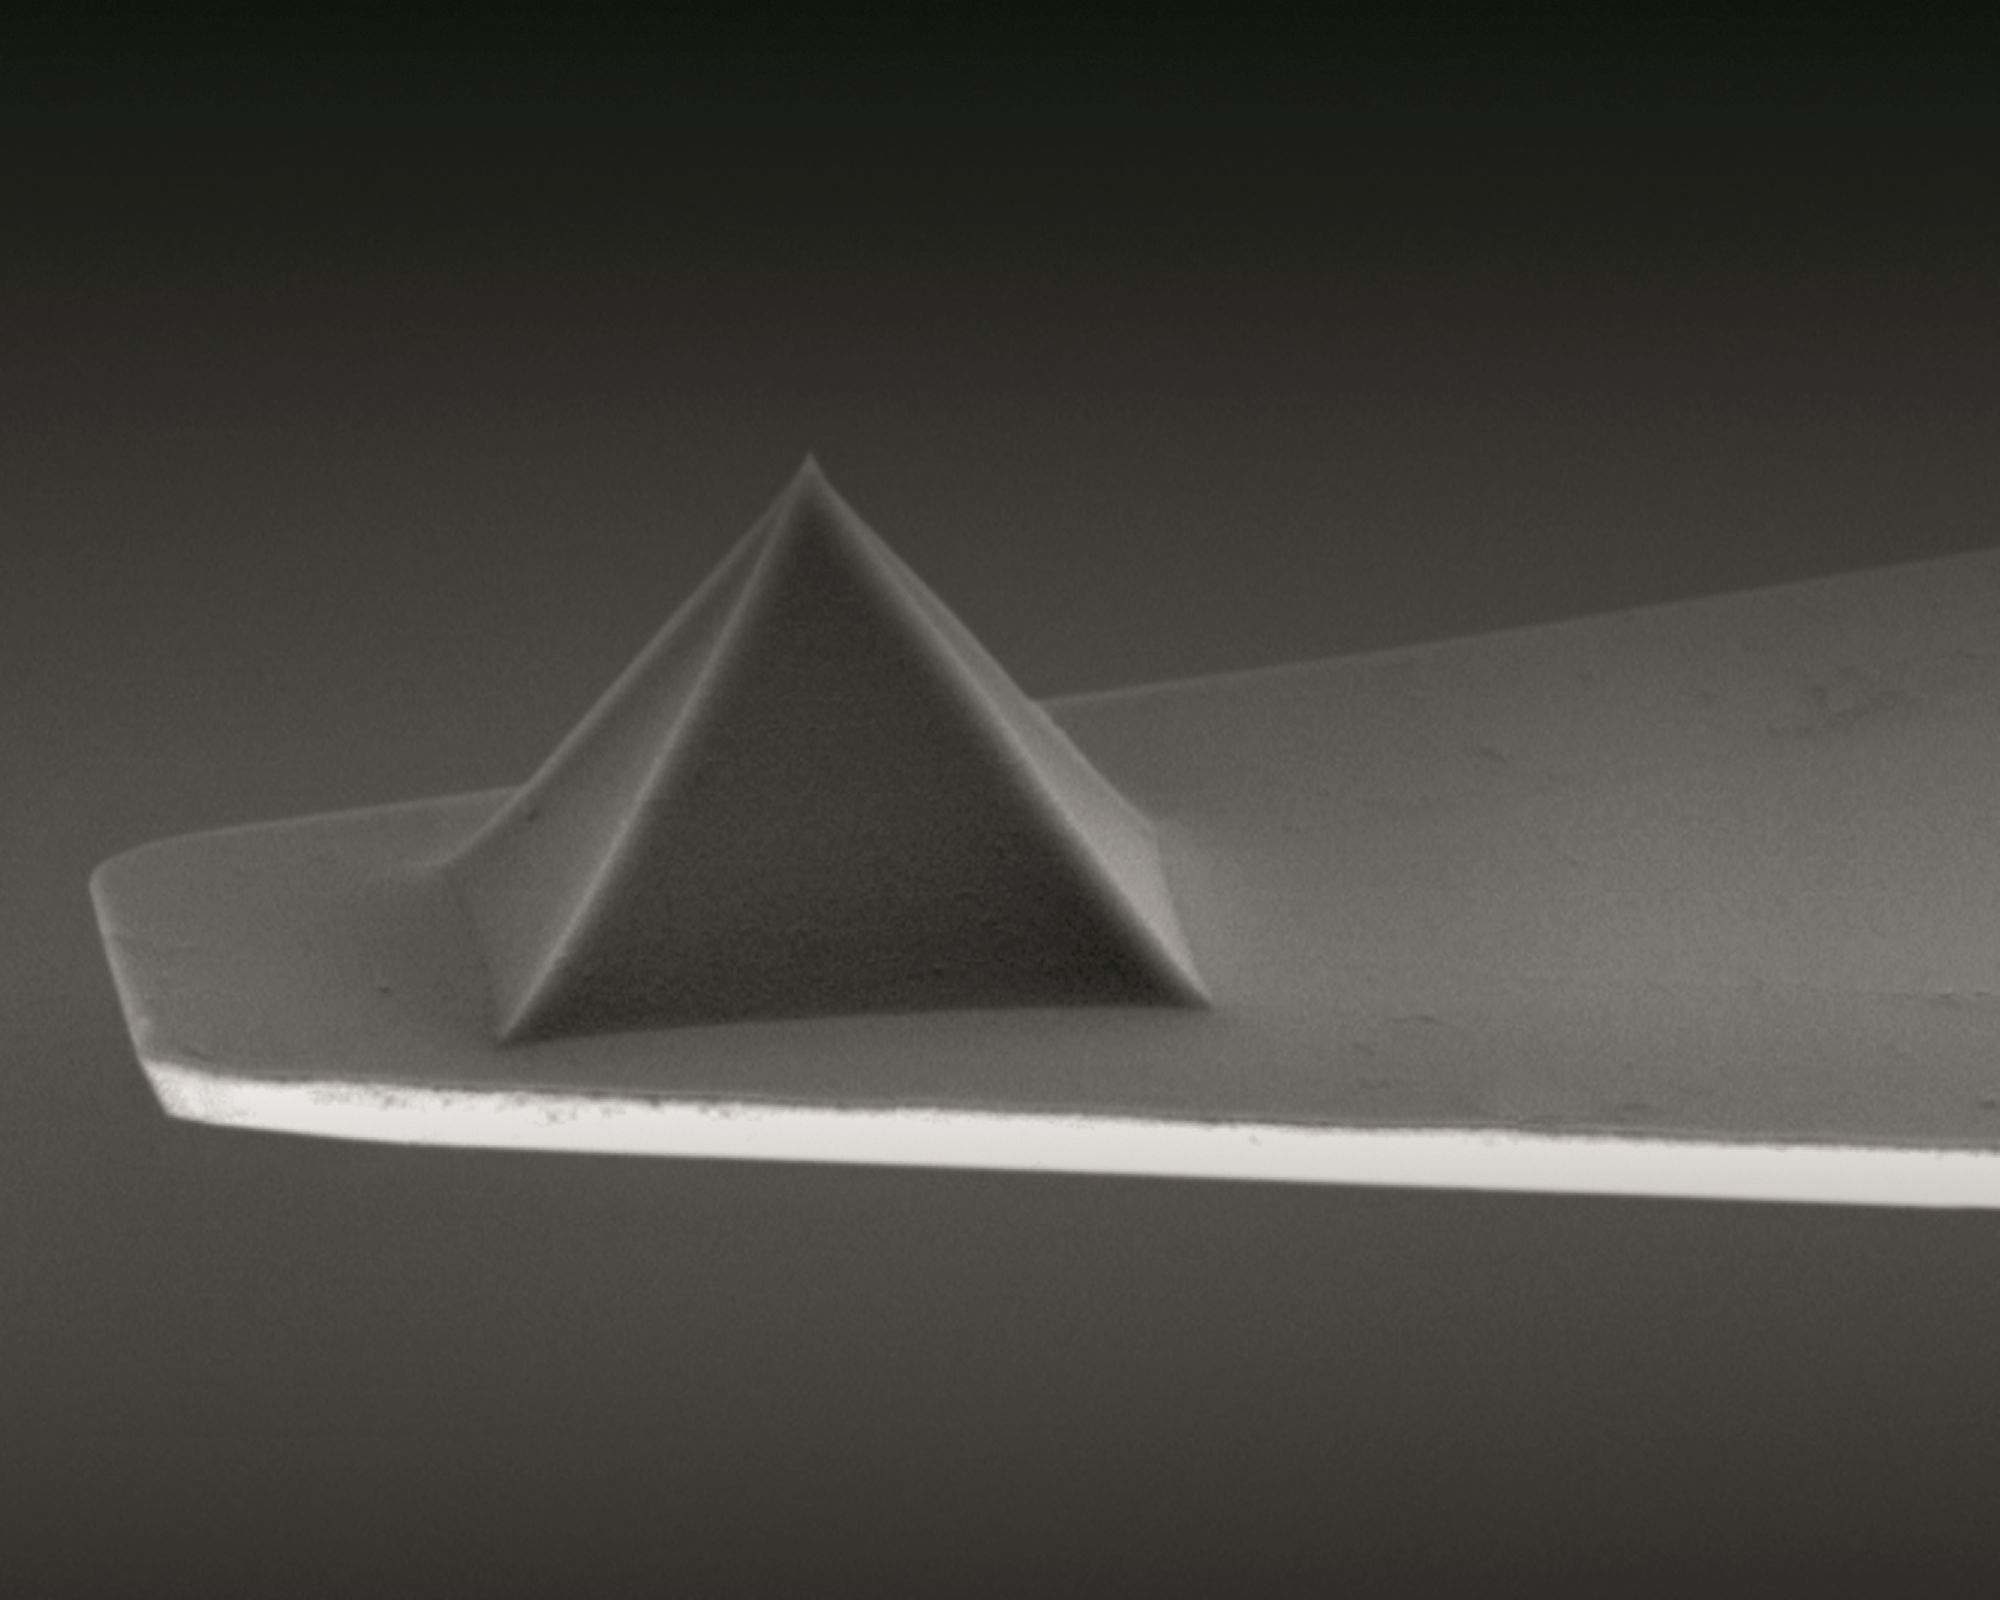
The investigation utilizes a scattering-type near-field optical microscope employing a metallized Arrow AFM tip ( NanoWorld Arrow-NCPt AFM probe) illuminated by monochromatic laser light. *

The AFM tip acts as an optical antenna, transforming the incident p-polarizedlight into a highly focused near field at the AFM tip apex, the so-called nanofocus. *

The nanofocus interacts with the sample leading to modified scattering from the AFM tip and encoding local sample properties.

In conventional s-SNOM operation, the elastically scattered light is recorded as function of sample position (note that the sample is scanned), yielding near-field optical images with a spatial resolution down to 10 nm. *

To supress background scattering, the AFM is operated in tapping mode and the detector signal is demodulated at a higher harmonic of the AFM tip’s oscillation frequency. *

In the article, Iris Niehues et al. use the s-SNOM instrument to study PL from individual hBN color centers. *

To that end, the inelastically tip-scattered light is recorded with a grating spectrometer coupled to a CCD camera. Note that signal demodulation has not been possible with the use of a CCD camera so far. It may be achieved employing a photomultiplier tube or similar. Importantly, the authors’ s-SNOM setup includes a high-quality, silver-protected off-axis parabolic mirror with a numerical aperture (NA) of 0.72, which optimizes the focusing and collection efficiency of the optical system and is crucial for the performed PL measurements. *

Characterization of photoluminescence mapping

In the specific experiments performed by “, Iris Niehues et al., the authors employ the near-field optical microscope in tapping mode, with low oscillation amplitudes between 20 nm and 30 nm, to detect PL signals influenced by the presence of the metallic AFM tip. *

They use standard metallic Arrow AFM tips (NanoWorld Arrow-NCPt) Throughout this study, Iris Niehues et al., use a 532 nm (2.33 eV) laser for the optical excitation of the hBN color centers. *

Figure 1 from Iris Niehues et al. 2025 “Nanoscale resolved mapping of the dipole emission of hBN color centers with a scattering-type scanning near-field optical microscope” :Photoluminescence (PL) measurement of a single color center taken with an AFM tip. The images are shown with the same color bar for better comparison of the observed PL intensities. (a) PL intensity map without the tip showing a diffraction limited emission spot. (b) PL spectrum of the studied emitter recorded with an extended integration time inside the arc in (c). The zero-phonon line (ZPL) and optical phonon sidebands (PSBs) of 160 meV are marked as well as the broad background PL (black line). (c) PL map of the same emitter with the AFM tip showing two subdiffraction limit features marked as “dot” and “arc.” (d) Lineprofiles along the dashed lines in (a) in black and (c) in red (dark measurement, bright Gaussian fits). The fitted full widths at half maximum (FWHM) are 110 nm (dot), 209 nm (arc), and 1,418 nm (w/o tip). (e) Schematic of the interference between direct and indirect excitation/emission of the color center via the AFM tip (TAPL). Inset shows the nanofocus interaction at the location of the color center explaining the dot (TEPL). (f) Analytical reproduction of the TAPL arc in (c) applying the model in (e). NanoWorld Arrow-NCPt AFM probes with a platinum iridium coating were used.
Figure 1 from Iris Niehues et al. 2025 “Nanoscale resolved mapping of the dipole emission of hBN color centers with a scattering-type scanning near-field optical microscope” :
Photoluminescence (PL) measurement of a single color center taken with an AFM tip. The images are shown with the same color bar for better comparison of the observed PL intensities. (a) PL intensity map without the tip showing a diffraction limited emission spot. (b) PL spectrum of the studied emitter recorded with an extended integration time inside the arc in (c). The zero-phonon line (ZPL) and optical phonon sidebands (PSBs) of 160 meV are marked as well as the broad background PL (black line). (c) PL map of the same emitter with the AFM tip showing two subdiffraction limit features marked as “dot” and “arc.” (d) Lineprofiles along the dashed lines in (a) in black and (c) in red (dark measurement, bright Gaussian fits). The fitted full widths at half maximum (FWHM) are 110 nm (dot), 209 nm (arc), and 1,418 nm (w/o tip). (e) Schematic of the interference between direct and indirect excitation/emission of the color center via the AFM tip (TAPL). Inset shows the nanofocus interaction at the location of the color center explaining the dot (TEPL). (f) Analytical reproduction of the TAPL arc in (c) applying the model in (e).

*Iris Niehues, Daniel Wigger, Korbinian Kaltenecker, Annika Klein-Hitpass , Philippe Roell, Aleksandra K. Dąbrowska, Katarzyna Ludwiczak, Piotr Tatarczak, Janne O. Becker , Robert Schmidt, Martin Schnell, Johannes Binder, Andrzej Wysmołek and Rainer Hillenbrand
Nanoscale resolved mapping of the dipole emission of hBN color centers with a scattering-type scanning near-field optical microscope
Nanophotonics, vol. 14, no. 3, 2025, pp. 335-342
DOI: https://doi.org/10.1515/nanoph-2024-0554

Open Access  The article “Nanoscale resolved mapping of the dipole emission of hBN color centers with a scattering-type scanning near-field optical microscope” by Iris Niehues, Daniel Wigger, Korbinian Kaltenecker, Annika Klein-Hitpass , Philippe Roell, Aleksandra K. Dąbrowska, Katarzyna Ludwiczak, Piotr Tatarczak, Janne O. Becker , Robert Schmidt, Martin Schnell, Johannes Binder, Andrzej Wysmołek and Rainer Hillenbrand is licensed under a Creative Commons Attribution 4.0 International License, which permits use, sharing, adaptation, distribution and reproduction in any medium or format, as long as you give appropriate credit to the original author(s) and the source, provide a link to the Creative Commons license, and indicate if changes were made. The images or other third party material in this article are included in the article’s Creative Commons license, unless indicated otherwise in a credit line to the material. If material is not included in the article’s Creative Commons license and your intended use is not permitted by statutory regulation or exceeds the permitted use, you will need to obtain permission directly from the copyright holder. To view a copy of this license, visit http://creativecommons.org/licenses/by/4.0/.

Cholesterol-regulated cellular stiffness may enhance evasion of NK cell-mediated cytotoxicity in gastric cancer stem cells

Gastric cancer has a high rate of recurrence, and as such, immunotherapy strategies are being investigated as a potential therapeutic strategy. *

Although the involvement of immune checkpoints in immunotherapy is well studied, biomechanical cues, such as target cell stiffness, have not yet been subject to the same level of investigation. *

Changes in the cholesterol content of the cell membrane directly influence tumor cell stiffness. *

In the article “Cholesterol-regulated cellular stiffness may enhance evasion of NK cell-mediated cytotoxicity in gastric cancer stem cells” Lijuan Zhu and Hongjin Wang investigate the effect of cholesterol on NK cell-mediated killing of gastric cancer stem-like cells. *

They report that surviving tumor cells with stem-like properties elevated cholesterol metabolism to evade NK cell cytotoxicity. *

Inhibition of cholesterol metabolism enhances NK cell-mediated killing of gastric cancer stem-like cells, highlighting a potential avenue for improving immunotherapy efficacy. *

This study suggests a possible effect of cancer cell stiffness on immune evasion and offers insights into enhancing immunotherapeutic strategies against tumors. *

Measurement of cell stiffness by AFM:

A customized commercially available atomic force microscope (AFM) and NanoWorld Pyrex-Nitride PNP-TR AFM probes were used for the measurement of cell stiffness by AFM. *

Atomic force microscopy cell stiffness was measured according to standard methodology. *

AFM force curves were captured with a customized AFM placed atop an inverted optical microscope that had a heating stage for live-cell imaging and a ×20 objective. Using an XY stage, the materials were moved until the desired cell, which could be observed under an optical microscope, was positioned beneath the AFM tip. Using a NanoWorld PNP-TR-B AFM cantilever (NanoWorld), the force curves on the cell were collected at a rate of ~ 5 μm·s−1 in the relative trigger mode (15 nm trigger threshold). *

By utilizing a thermal tuning and the deflection sensitivity of 170 nm·V−1, the AFM cantilever spring constant was determined to be 0.08 N·m−1. *

Single cells were measured both before and after treatment at 37 °C. The force curves were processed using the AFM’s analysis software, which also computed the Young’s modulus of the sample. This was accomplished by fitting the approach curve to an indentation of less than 500 nm (to account for stiffness) and assuming a cortical Poisson’s ratio of 0.3.*

NanoWorld Pyrex-Nitride PNP AFM probe - silicon nitride AFM cantilever and silicon nitride AFM tip
NanoWorld Pyrex-Nitride AFM probe series – AFM tip and AFM cantilever made of silicon nitride

*Lijuan Zhu and Hongjin Wang
Cholesterol-regulated cellular stiffness may enhance evasion of NK cell-mediated cytotoxicity in gastric cancer stem cells
FEBS Open Bio, Volume 14, Issue 5, May 2024, Pages 855-866
DOI: https://doi.org/10.1002/2211-5463.13793

Open Access  The article “Cholesterol-regulated cellular stiffness may enhance evasion of NK cell-mediated cytotoxicity in gastric cancer stem cells” by Lijuan Zhu and Hongjin Wang is licensed under a Creative Commons Attribution 4.0 International License, which permits use, sharing, adaptation, distribution and reproduction in any medium or format, as long as you give appropriate credit to the original author(s) and the source, provide a link to the Creative Commons license, and indicate if changes were made. The images or other third party material in this article are included in the article’s Creative Commons license, unless indicated otherwise in a credit line to the material. If material is not included in the article’s Creative Commons license and your intended use is not permitted by statutory regulation or exceeds the permitted use, you will need to obtain permission directly from the copyright holder. To view a copy of this license, visit http://creativecommons.org/licenses/by/4.0/.

Mechanism for Vipp 1 spiral formation, ring biogenesis, and membrane repair

The ESCRT-III-like protein Vipp1 couples filament polymerization with membrane remodeling. It assembles planar sheets as well as 3D rings and helical polymers, all implicated in mitigating plastid-associated membrane stress. The architecture of Vipp1 planar sheets and helical polymers remains unknown, as do the geometric changes required to transition between polymeric forms. *

In the article “Mechanism for Vipp1 spiral formation, ring biogenesis, and membrane repair” Souvik Naskar, Andrea Merino, Javier Espadas, Jayanti Singh, Aurelien Roux, Adai Colom and Harry H. Low show how cyanobacterial Vipp1 assembles into morphologically-related sheets and spirals on membranes in vitro.*

The spirals converge to form a central ring similar to those described in membrane budding. Cryo-EM structures of helical filaments reveal a close geometric relationship between Vipp1 helical and planar lattices. Moreover, the helical structures reveal how filaments twist—a process required for Vipp1, and likely other ESCRT-III filaments, to transition between planar and 3D architectures. *

Overall, the authors’ results provide a molecular model for Vipp1 ring biogenesis and a mechanism for Vipp1 membrane stabilization and repair, with implications for other ESCRT-III systems. *

NanoWorld Ultra-Short Cantilevers USC-F0.3-k0.3  for High-Speed AFM (HS-AFM) with a typical spring constant of 0.3 N nm−1 and a typical resonance frequency of about 300 kHz were used for image acquisition with fast scanning atomic force microscopy.*

Fig. 2 from Souvik Naskar et al. 2024 “Mechanism for Vipp1 spiral formation, ring biogenesis, and membrane repair”:Vipp1 assembles dynamic networks of spirals, rings and sheets on membrane a, F-AFM phase timecourse showing Vipp1 recruitment to the highly curved edge of membrane patches. Scan rate, 70 Hz; 256 × 256 pixels. The area in the dashed box is enlarged in b. b, Spiral and ring formation localized to the membrane edge. Scan rate, 70 Hz; 256 × 256 pixels. c, Left, phase timecourse showcasing a dense network of sheets, spirals, and rings that ultimately cover the entire membrane plane. Right, average of six F-AFM height images. Scan rate, 120 Hz; 256 × 256 pixels. d, Average F-AFM height image showing Vipp1 sheet, spiral, and ring detail. Red arrows mark the sheet branching into filaments ~13 nm wide. Scan rate, 20 Hz; 256 × 256 pixels. e, Vipp1 sheet and spiral filament height offset from the membrane. f–i, Quantification of Vipp1 filament and spiral characteristics. n = 124, 13, 278, and 278 independent measurements for panels f, g, h, and i, respectively. Error bars show one s.d. of the mean. NanoWorld Ultra-Short Cantilevers USC-F0.3-k0.3-10 with a typical spring constant of 0.3 N nm−1 and a typical resonance frequency of about 300 kHz were used for image acquisition.
Fig. 2 from Souvik Naskar et al. 2024 “Mechanism for Vipp1 spiral formation, ring biogenesis, and membrane repair”:
Vipp1 assembles dynamic networks of spirals, rings and sheets on membrane
a, F-AFM phase timecourse showing Vipp1 recruitment to the highly curved edge of membrane patches. Scan rate, 70 Hz; 256 × 256 pixels. The area in the dashed box is enlarged in b. b, Spiral and ring formation localized to the membrane edge. Scan rate, 70 Hz; 256 × 256 pixels. c, Left, phase timecourse showcasing a dense network of sheets, spirals, and rings that ultimately cover the entire membrane plane. Right, average of six F-AFM height images. Scan rate, 120 Hz; 256 × 256 pixels. d, Average F-AFM height image showing Vipp1 sheet, spiral, and ring detail. Red arrows mark the sheet branching into filaments ~13 nm wide. Scan rate, 20 Hz; 256 × 256 pixels. e, Vipp1 sheet and spiral filament height offset from the membrane. f–i, Quantification of Vipp1 filament and spiral characteristics. n = 124, 13, 278, and 278 independent measurements for panels f, g, h, and i, respectively. Error bars show one s.d. of the mean.

*Souvik Naskar, Andrea Merino, Javier Espadas, Jayanti Singh, Aurelien Roux, Adai Colom and Harry H. Low
Mechanism for Vipp1 spiral formation, ring biogenesis, and membrane repair
Nature Structural & Molecular Biology (2024)
DOI: https://doi.org/10.1038/s41594-024-01401-8

Open Access The article “Mechanism for Vipp1 spiral formation, ring biogenesis, and membrane repair” by Souvik Naskar, Andrea Merino, Javier Espadas, Jayanti Singh, Aurelien Roux, Adai Colom and Harry H. Low is licensed under a Creative Commons Attribution 4.0 International License, which permits use, sharing, adaptation, distribution and reproduction in any medium or format, as long as you give appropriate credit to the original author(s) and the source, provide a link to the Creative Commons license, and indicate if changes were made. The images or other third party material in this article are included in the article’s Creative Commons license, unless indicated otherwise in a credit line to the material. If material is not included in the article’s Creative Commons license and your intended use is not permitted by statutory regulation or exceeds the permitted use, you will need to obtain permission directly from the copyright holder. To view a copy of this license, visit http://creativecommons.org/licenses/by/4.0/.